
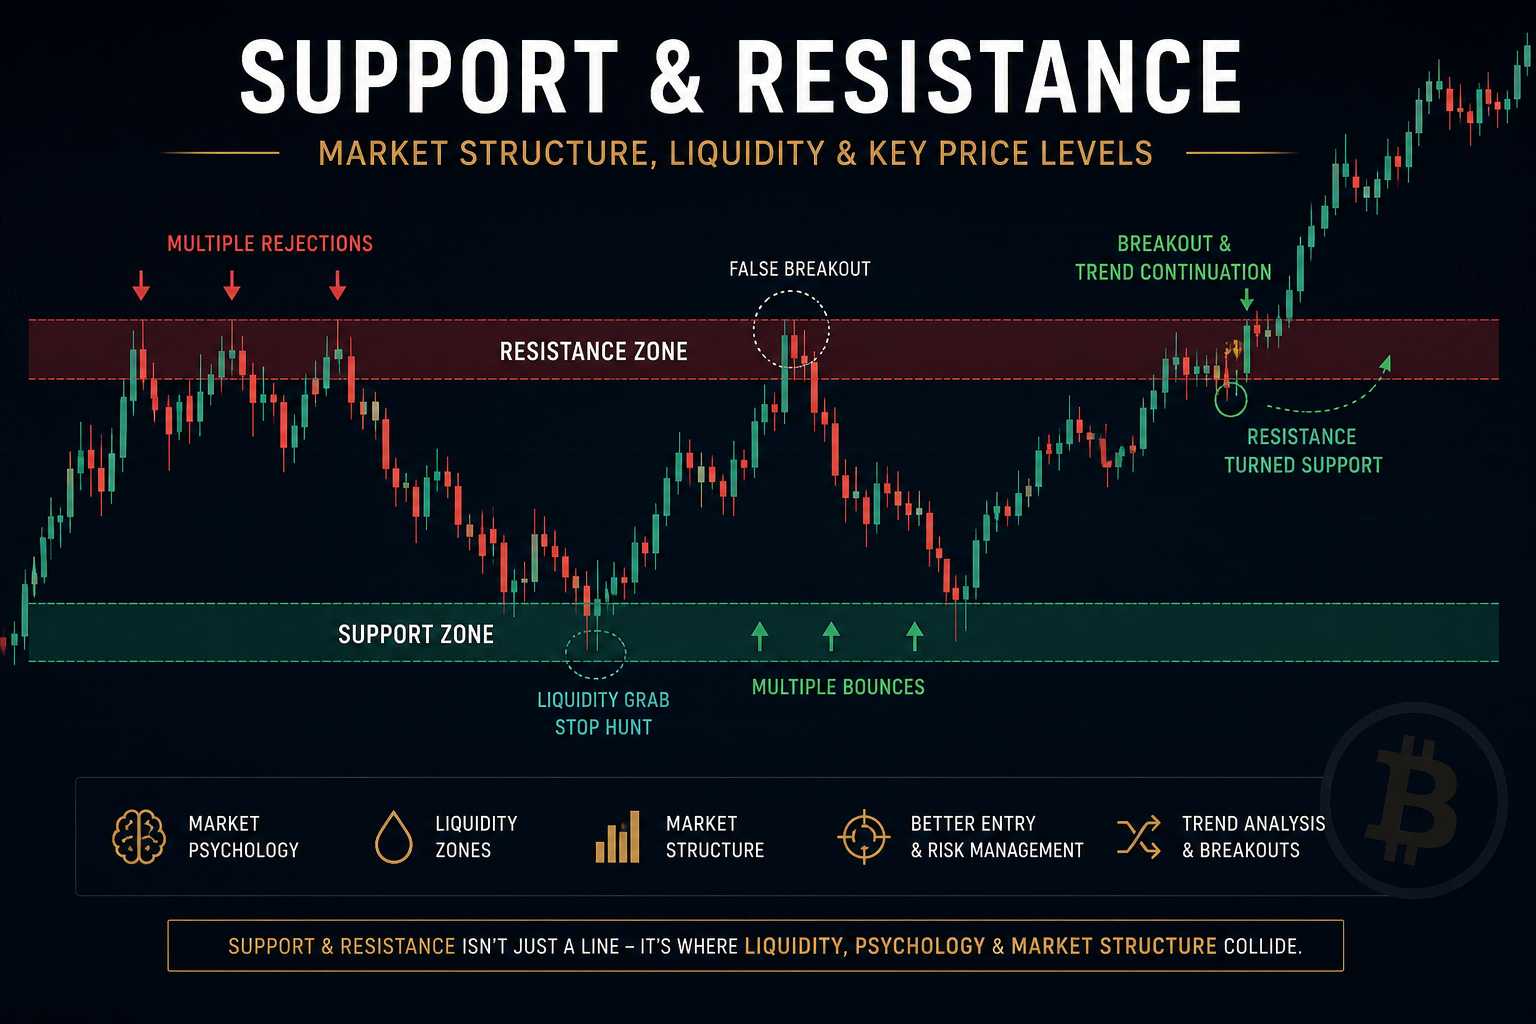
Support and resistance remain among the most important concepts in cryptocurrency market analysis.
Unlike many technical indicators that rely on mathematical formulas, support and resistance levels are directly connected to:
- market psychology
- liquidity behavior
- trader positioning
- supply and demand dynamics
- market structure
- emotional reactions
- volatility expansion
Because crypto markets are highly emotional and heavily driven by liquidity flows, support and resistance zones often become major decision areas for:
- traders
- investors
- institutions
- algorithmic systems
- market makers
However, many inexperienced traders misunderstand how support and resistance actually work.
Support and resistance are not exact price lines that guarantee reversals.
Instead, they represent areas where buying pressure, selling pressure, liquidity, and market psychology often interact aggressively.
Used correctly, support and resistance analysis can improve:
- market structure understanding
- risk management
- entry positioning
- trend interpretation
- breakout analysis
Used incorrectly, it can lead to emotional trading, false confidence, and repeated losses during volatile market conditions.
In this analysis, we’ll explore:
- what support and resistance are
- why key price levels matter
- psychological market behavior
- breakout and rejection dynamics
- liquidity zones and stop hunts
- support turning into resistance
- resistance turning into support
- false breakouts and fakeouts
- how professional investors analyze market structure
- the strengths and limitations of support and resistance analysis
What Is Support in Crypto Markets?
Support is a price area where buying pressure historically becomes strong enough to slow, pause, or temporarily reverse a market decline.
In simple terms:
support is an area where demand may begin overpowering supply.
Support zones often form because traders and investors believe:
- prices are becoming attractive
- downside risk is decreasing
- value opportunities are improving
- panic selling may be exhausted
When price approaches support:
buyers often become more active.
This can create:
- temporary stabilization
- consolidation
- rebounds
- volatility compression
However, support is never guaranteed to hold.
If selling pressure becomes strong enough, support can fail aggressively.
What Is Resistance in Crypto Markets?
Resistance is a price area where selling pressure historically becomes strong enough to slow, pause, or temporarily reverse upward price movement.
In simple terms:
resistance is an area where supply may begin overpowering demand.
Resistance often forms because traders:
- take profits
- reduce risk exposure
- close positions
- become psychologically cautious near previous highs
When price approaches resistance:
selling activity often increases.
This may create:
- rejections
- consolidation
- failed breakouts
- volatility spikes
Like support, resistance is not permanent.
Strong momentum and liquidity can eventually break resistance levels.
Why Support and Resistance Matter
Support and resistance help traders identify important market structure zones.
These areas often influence:
- trader psychology
- liquidity concentration
- volatility expansion
- breakout behavior
- risk management decisions
Because millions of traders monitor similar price zones, support and resistance levels can become partially self-fulfilling.
Large market participants also frequently interact around major liquidity areas.
This is one reason key levels often generate strong reactions in crypto markets.
Support and Resistance as Market Psychology
Support and resistance are deeply connected to crowd psychology.
Support Psychology
At support levels:
- fear may decrease
- buyers may become more confident
- sellers may begin exhausting momentum
Resistance Psychology
At resistance levels:
- profit-taking increases
- fear of reversal grows
- buyers become more cautious
These emotional dynamics create repeated behavioral patterns across financial markets.
Because crypto markets are highly sentiment-driven, these psychological reactions often become amplified during periods of extreme volatility.
How Support and Resistance Form
Support and resistance zones often develop around:
- previous highs and lows
- consolidation areas
- breakout zones
- high-volume regions
- psychological round numbers
- moving averages
- liquidity clusters
For example:
Bitcoin near major round numbers like:
- $50,000
- $100,000
may attract strong psychological reactions because traders naturally focus on highly visible price levels.
Support Becoming Resistance
One of the most important concepts in market structure analysis is role reversal.
When support breaks:
- that previous support area may later act as resistance.
Why?
Because traders who bought at support and experienced losses may attempt to exit positions when price revisits the same zone.
This creates additional selling pressure.
Resistance Becoming Support
The opposite can also occur.
When resistance breaks successfully:
- that previous resistance zone may later become support.
This often happens because:
- breakout traders enter positions
- previous sellers become buyers
- market sentiment improves
This process is extremely common during strong bullish market trends.
Breakouts and Market Structure
Breakouts occur when price moves aggressively through support or resistance zones.
Bullish breakouts may signal:
- increasing momentum
- strong demand
- liquidity expansion
- improving sentiment
Bearish breakdowns may signal:
- weakening structure
- panic selling
- liquidity collapse
- broader risk-off behavior
However, not all breakouts are legitimate.
Crypto markets frequently experience:
- fakeouts
- liquidity traps
- stop hunts
- temporary volatility spikes
Understanding breakout quality is extremely important.
False Breakouts and Fakeouts
False breakouts occur when price temporarily moves beyond key levels before quickly reversing back into the prior range.
These fakeouts are extremely common in crypto markets because of:
- leveraged trading
- liquidation cascades
- thin liquidity
- emotional retail behavior
- algorithmic volatility
False breakouts often trap traders who enter positions too aggressively without confirmation.
Professional investors usually wait for:
- volume confirmation
- sustained structure
- retests
- liquidity stabilization
before treating breakouts as reliable trend continuation signals.
Liquidity Zones and Stop Hunts
Support and resistance zones often contain large concentrations of liquidity.
This includes:
- stop-loss orders
- leveraged positions
- breakout entries
- liquidation triggers
Large market participants sometimes exploit these liquidity zones through aggressive volatility spikes.
This behavior is commonly called:
- stop hunting
For example:
price may briefly break support to trigger liquidations before reversing upward aggressively.
Understanding liquidity behavior helps traders avoid emotional reactions during high-volatility conditions.
Support and Resistance Across Timeframes
Support and resistance exist on all timeframes.
Shorter Timeframes
Used for:
- intraday trading
- scalp setups
- short-term volatility analysis
Crypto Day Trading: Structural Risks and Capital Erosion
Higher Timeframes
Used for:
- macro structure
- long-term trend analysis
- major cycle positioning
- institutional accumulation zones
Higher timeframe levels are generally viewed as more structurally important.
Long-Term Investing in Crypto: Strategy, Psychology and Capital Allocation
How Professional Investors Use Support and Resistance
Professional traders rarely treat support and resistance as exact price lines.
Instead, they analyze:
- zones
- liquidity behavior
- volatility conditions
- order flow
- broader market structure
Support and resistance are often combined with:
- volume analysis
- moving averages
- derivatives positioning
- macroeconomic conditions
- sentiment analysis
- trend structure
This broader framework improves context awareness and reduces emotional decision-making.
Risks and Limitations
Despite their importance, support and resistance analysis has limitations.
These include:
- false breakouts
- subjective interpretation
- emotional bias
- unpredictable volatility
- news-driven market reactions
- liquidity manipulation
Most importantly:
support and resistance do not predict the future.
They only identify areas where reactions may become more likely.
This distinction is critical.
No price level is guaranteed to hold.
Conclusion
Support and resistance remain foundational concepts within cryptocurrency market analysis because they help traders understand:
- market structure
- liquidity behavior
- psychological reactions
- breakout environments
- trend continuation
- volatility expansion
Used correctly, support and resistance analysis can improve:
- risk management
- trend interpretation
- emotional discipline
- breakout evaluation
- liquidity awareness
However, support and resistance should never be viewed as guaranteed reversal signals or perfect predictive tools.
Professional investors typically combine support and resistance analysis with:
- market structure
- liquidity conditions
- volume analysis
- macro frameworks
- sentiment evaluation
- volatility assessment
In highly volatile crypto markets, context matters far more than any individual price level alone.
Ultimately, support and resistance work best when treated as dynamic liquidity zones within a broader market framework — not as exact lines capable of predicting market direction with certainty.
RSI Explained in Crypto: How Investors Use the Relative Strength Index
Part 2: Understanding Market Signals – Think Like a Smart Crypto Investor
Part 3: Reading On-Chain Data & Indicators – Advanced Crypto Investing Strategies
Disclaimer: This article is for educational purposes only and does not constitute financial or investment advice. Cryptocurrency markets are volatile and high risk. Always do your own research before making any investment decisions.