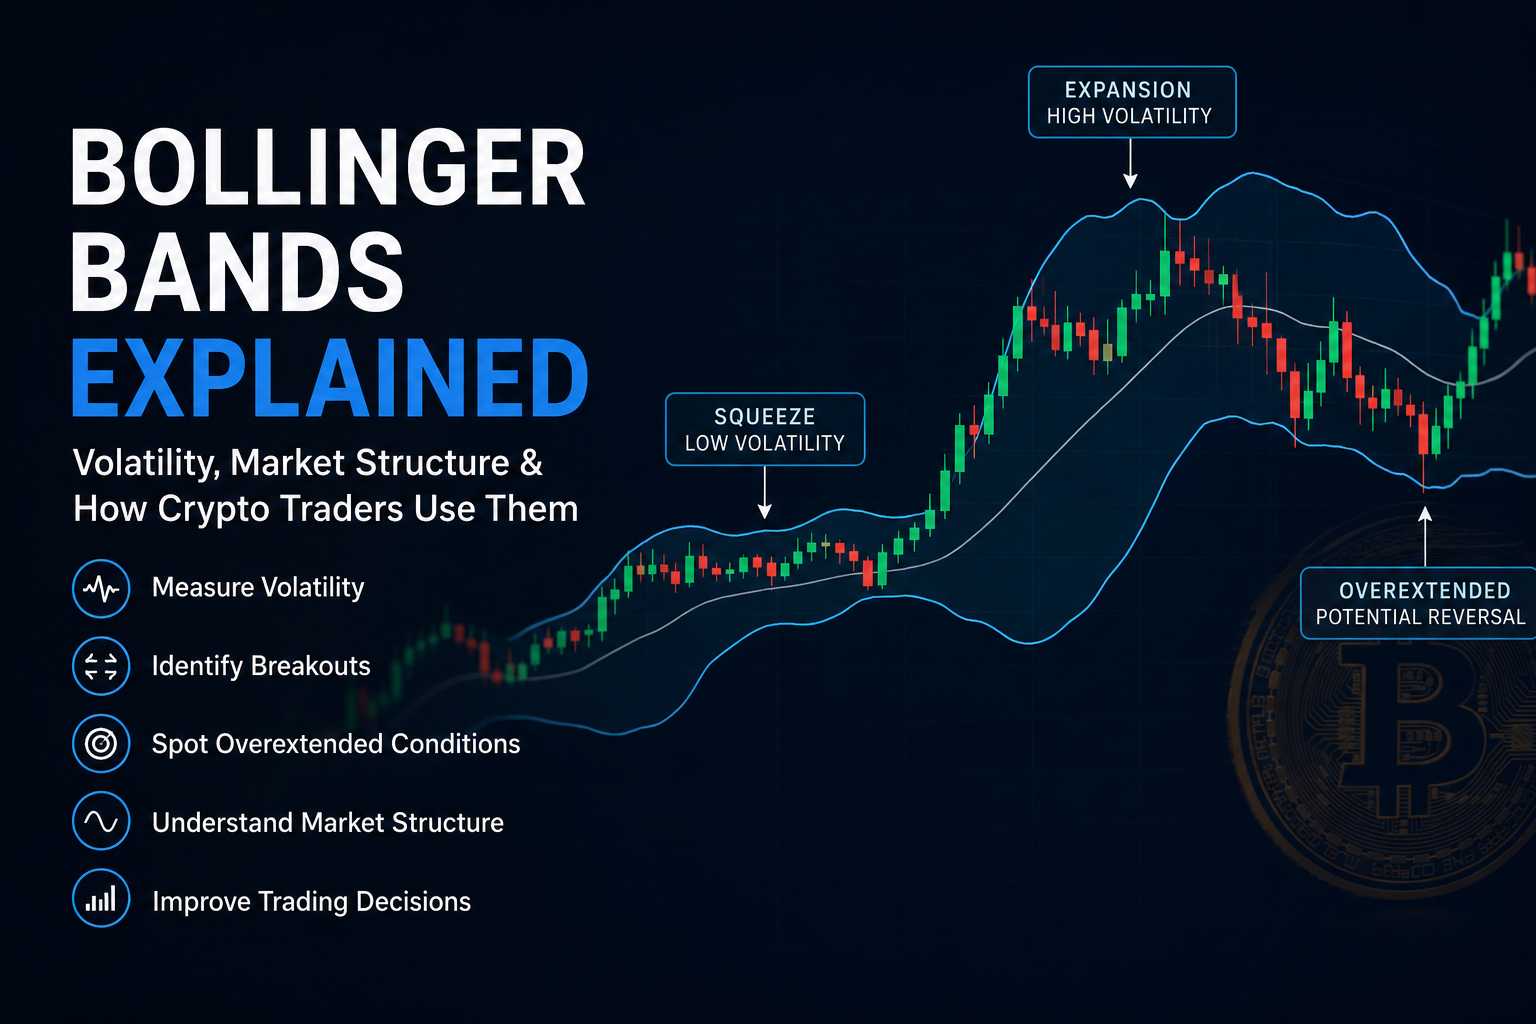
Bollinger Bands remain one of the most widely used volatility indicators in cryptocurrency markets.
Unlike indicators focused primarily on momentum or trend direction, Bollinger Bands are designed to measure:
- market
Bollinger Bands remain one of the most widely used volatility indicators in cryptocurrency markets.
Unlike indicators focused primarily on momentum or trend direction, Bollinger Bands are designed to measure:
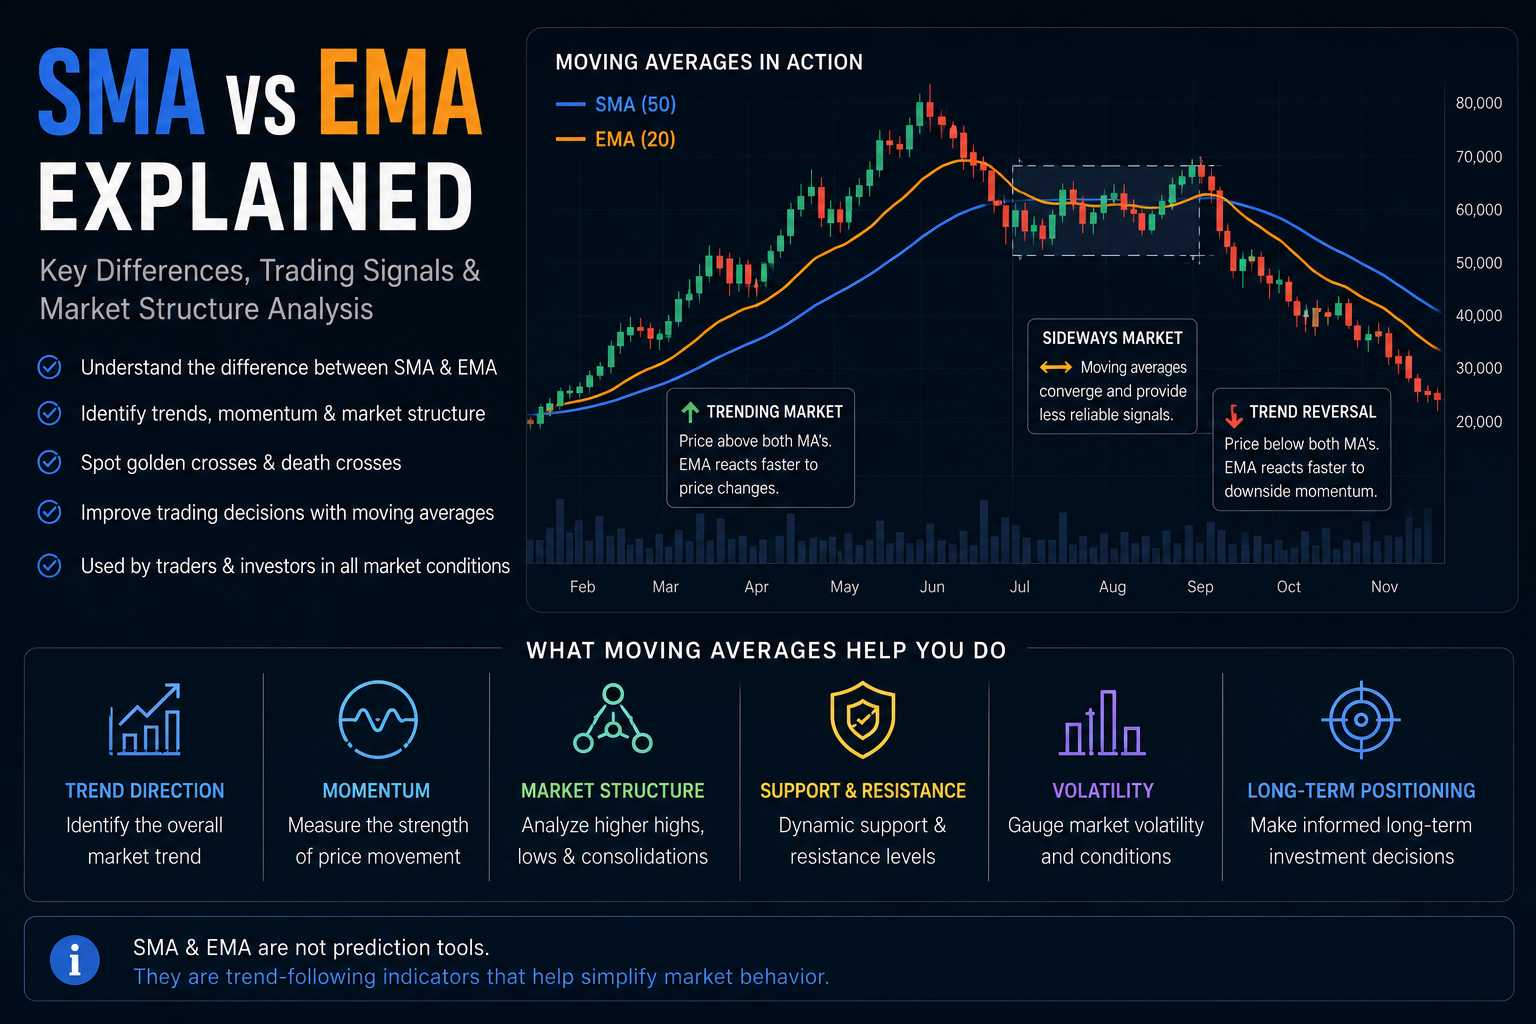
Moving averages are among the most widely used indicators in financial markets.
In cryptocurrency markets, traders and investors frequently use moving averages to analyze:
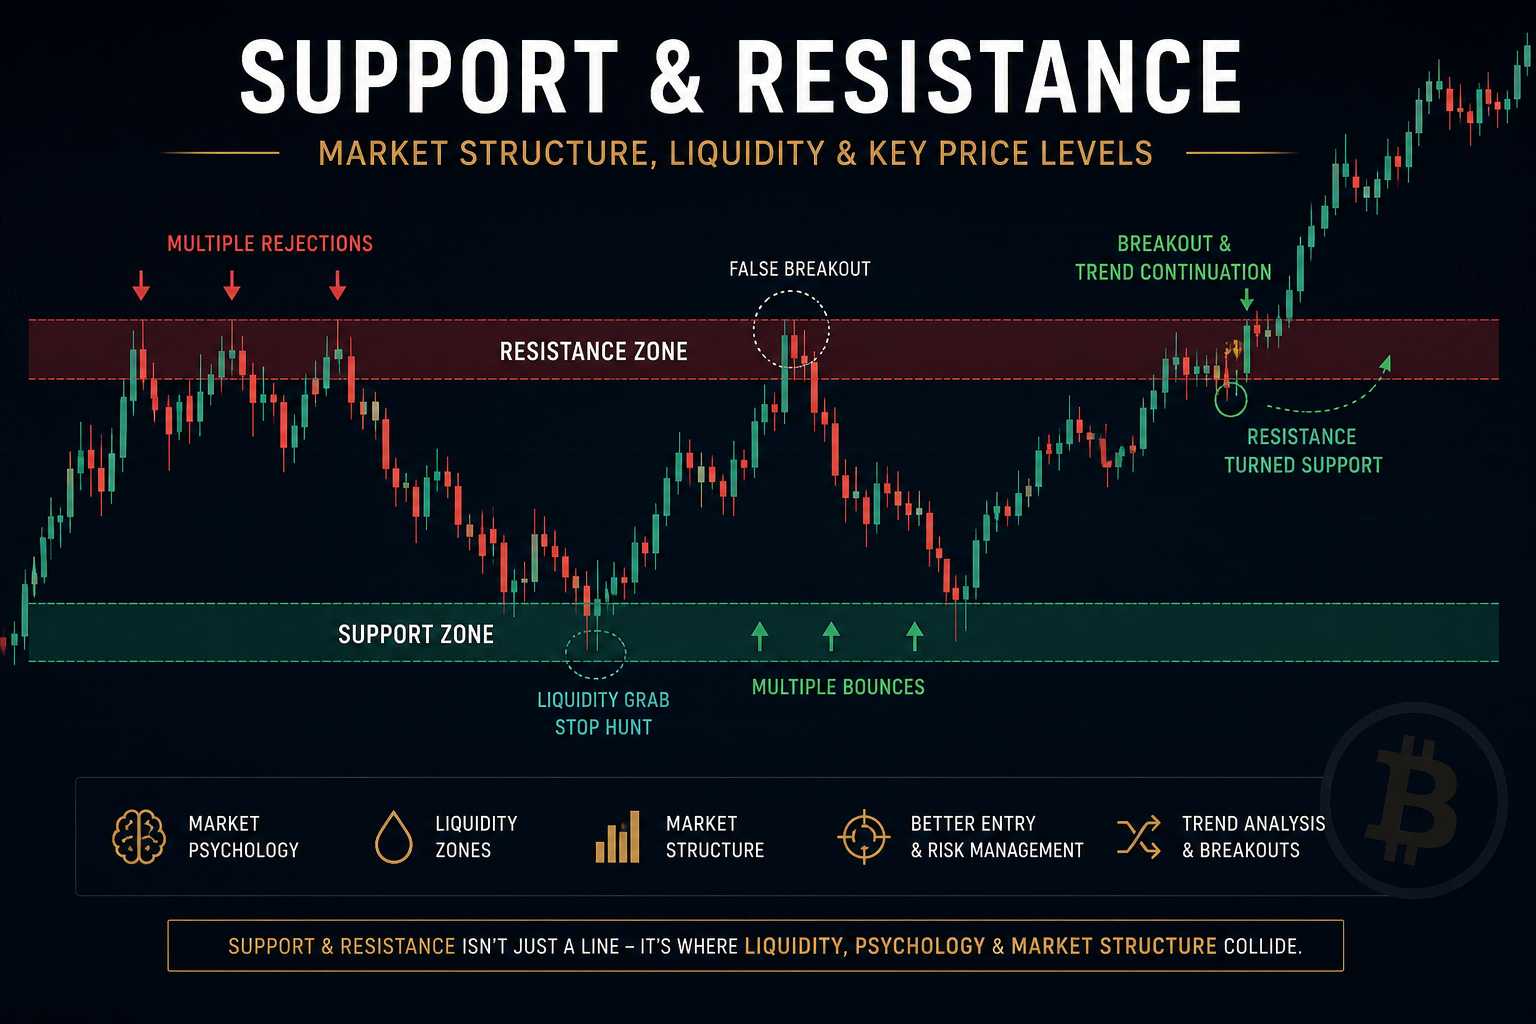
Support and resistance remain among the most important concepts in cryptocurrency market analysis.
Unlike many technical indicators that rely on mathematical formulas, support and resistance levels are directly connected to:… Read More “Support and Resistance Explained: Market Structure, Liquidity & How Crypto Traders Use Key Price Levels”