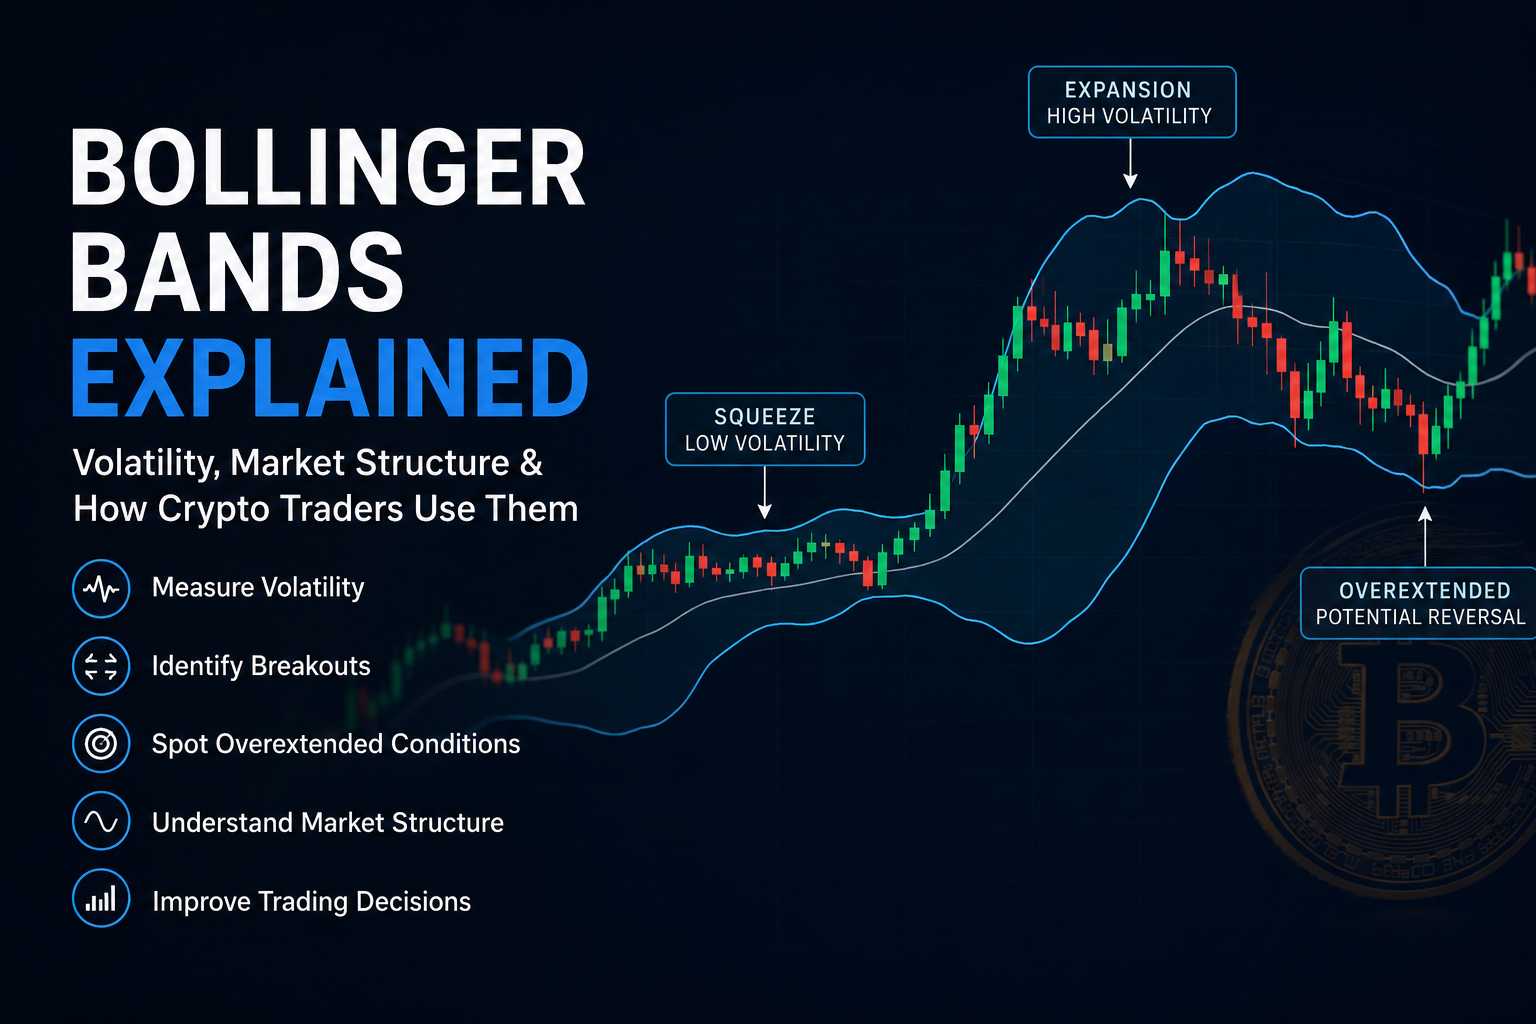
Bollinger Bands Explained: Volatility, Market Structure & How Crypto Traders Use Them

Bollinger Bands remain one of the most widely used volatility indicators in cryptocurrency markets.

Unlike indicators focused primarily on momentum or trend direction, Bollinger Bands are designed to measure:

  • market
Read More “Bollinger Bands Explained: Volatility, Market Structure & How Crypto Traders Use Them”

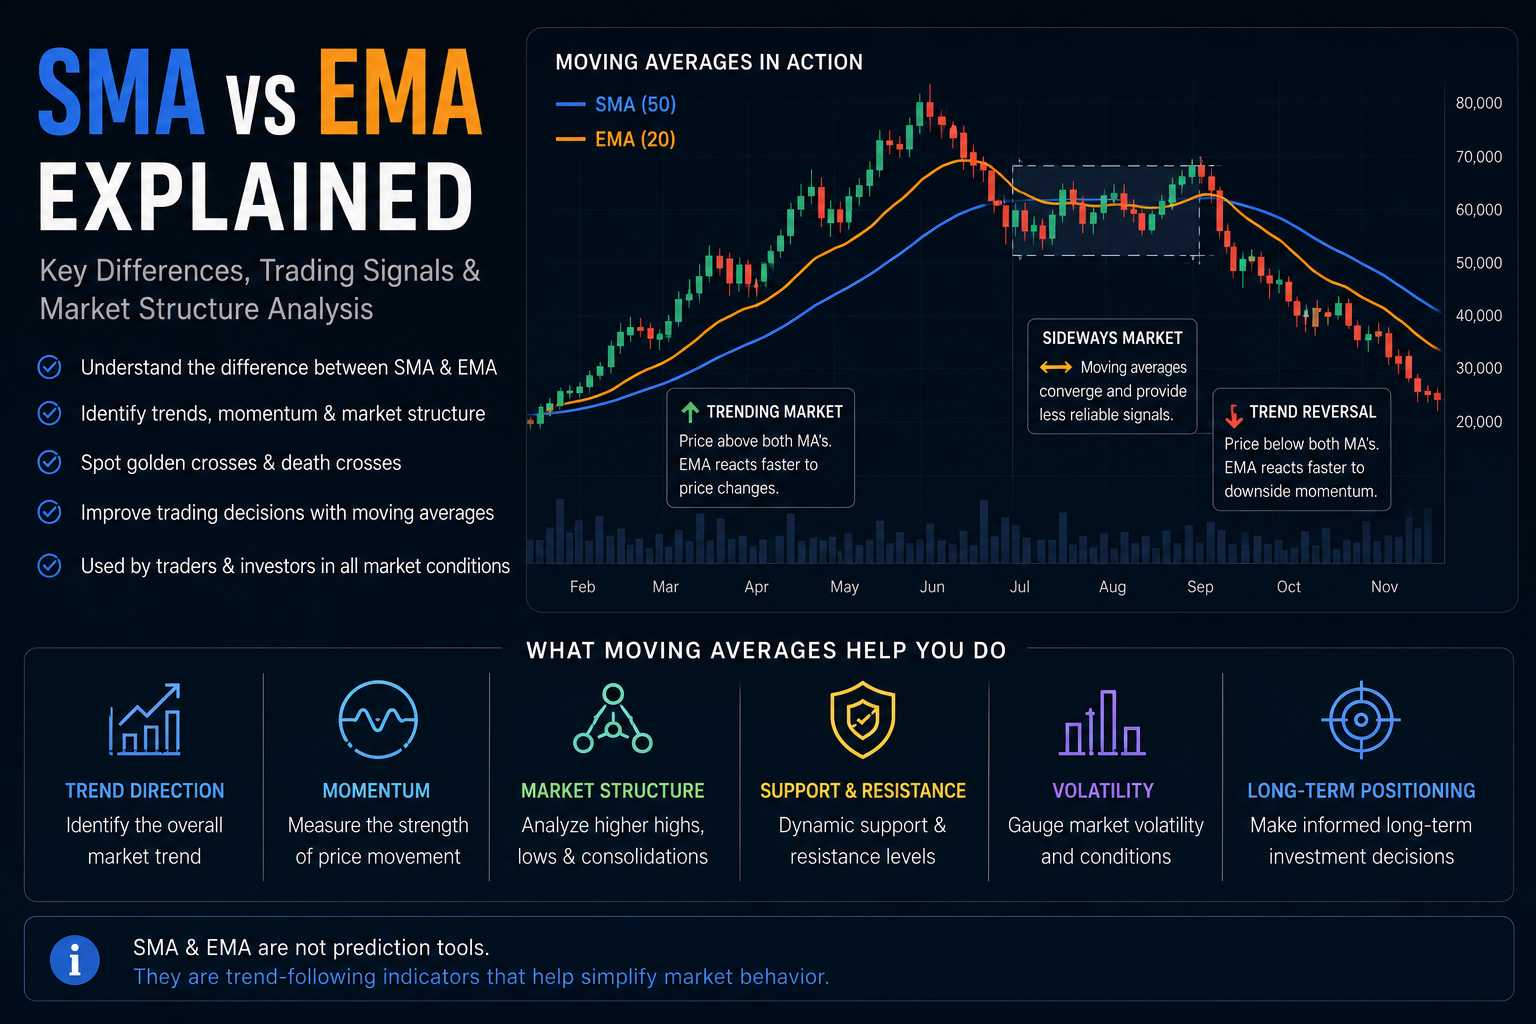
SMA vs EMA Explained: Key Differences, Trading Signals & Market Structure Analysis

Moving averages are among the most widely used indicators in financial markets.

In cryptocurrency markets, traders and investors frequently use moving averages to analyze:

  • trend direction
  • momentum
  • market structure
  • support
Read More “SMA vs EMA Explained: Key Differences, Trading Signals & Market Structure Analysis”

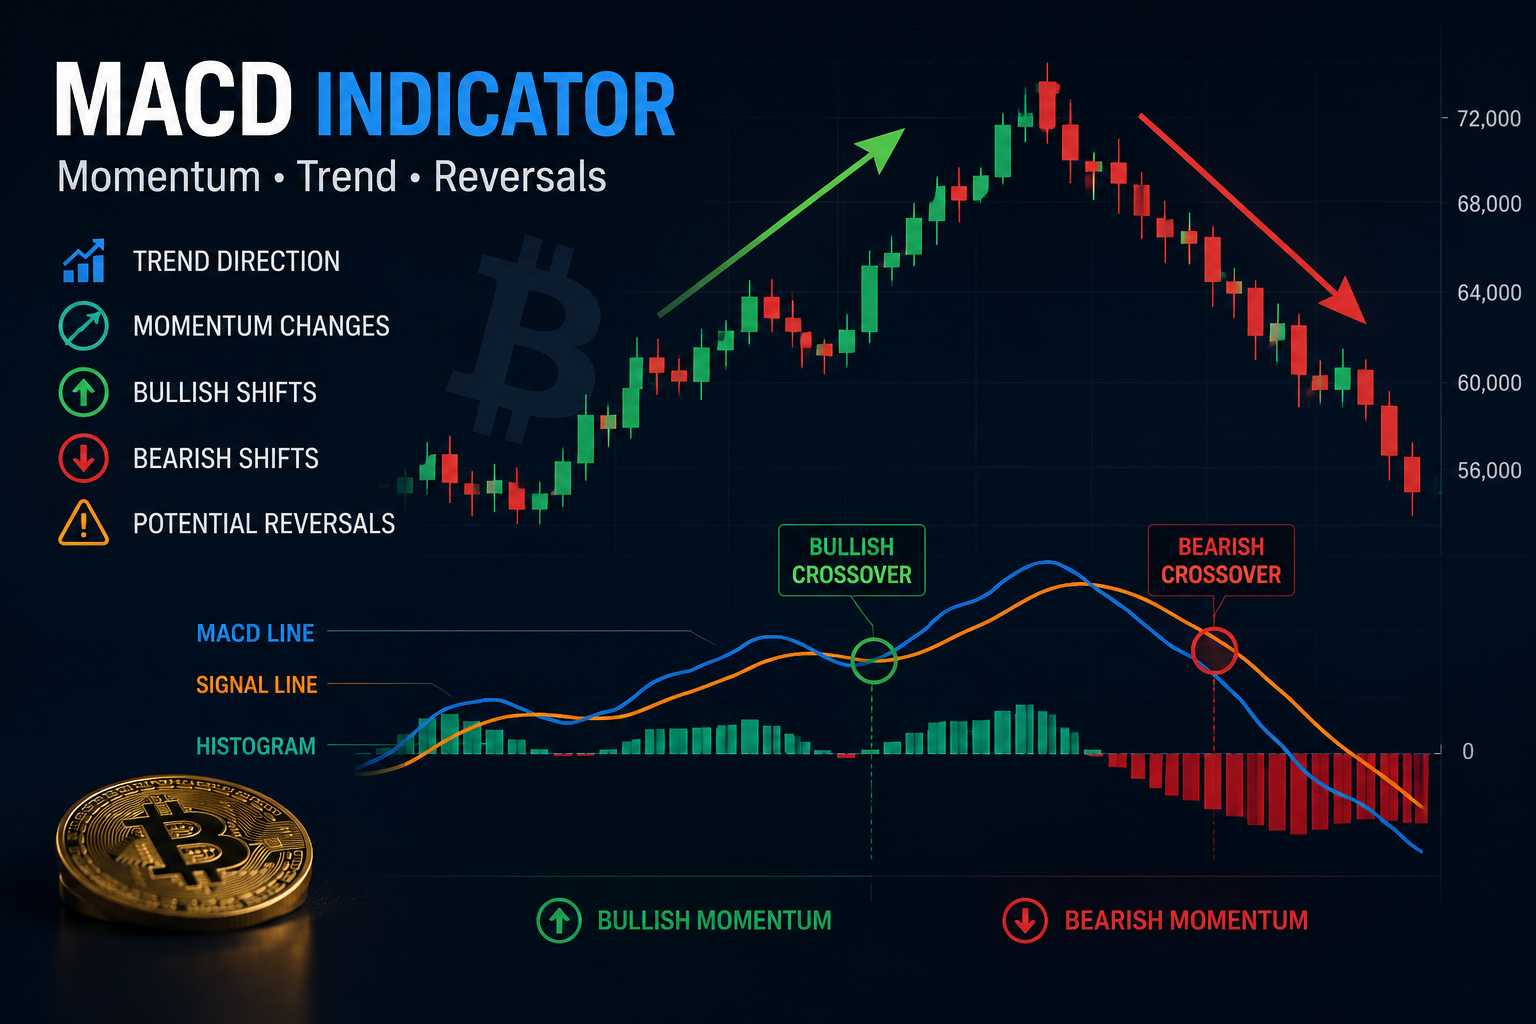
MACD Indicator in Crypto: Understanding Momentum, Trend Strength & Market Reversals

Cryptocurrency markets are heavily driven by momentum.

Strong rallies can accelerate far beyond expectations, while sudden reversals can erase gains rapidly. Because of this, many investors and traders rely on … Read More “MACD Indicator in Crypto: Understanding Momentum, Trend Strength & Market Reversals”

RSI Explained in Crypto: How Investors Use the Relative Strength Index

Cryptocurrency markets are highly emotional, fast-moving, and extremely volatile. Prices can rise aggressively within days, collapse unexpectedly, and reverse direction before most investors fully understand what happened.

Because of this … Read More “RSI Explained in Crypto: How Investors Use the Relative Strength Index”