
Cryptocurrency markets can change direction extremely quickly.
Momentum accelerates.
Buying pressure disappears.
Short-term corrections develop.
And new rallies can begin before slower indicators fully react.
Because of this, traders often use momentum indicators to identify changes in market strength before they become obvious through price action alone.
One of the most sensitive momentum indicators is the Stochastic Relative Strength Index, commonly known as Stochastic RSI or Stoch RSI.
Stochastic RSI builds on the traditional Relative Strength Index (RSI).
However, instead of measuring price momentum directly, Stochastic RSI measures the position of RSI relative to its own recent range.
This makes the indicator significantly more responsive.
It can identify short-term momentum shifts earlier than traditional RSI.
But that additional sensitivity comes with an important disadvantage:
More signals also mean more noise.
In highly volatile cryptocurrency markets, Stochastic RSI can move rapidly between overbought and oversold conditions, sometimes generating multiple signals without any meaningful change in the broader trend.
For this reason, professional traders rarely use Stochastic RSI in isolation.
Instead, they combine it with:
- Market structure.
- Support and resistance.
- Trading volume.
- Trend analysis.
- Other technical indicators.
Understanding how Stochastic RSI works—and where it fails—can help traders use the indicator as a momentum tool rather than treating every crossover as a trading signal.
In This Analysis, We’ll Explore:
- What Stochastic RSI is
- How Stochastic RSI works
- Stochastic RSI vs traditional RSI
- How Stochastic RSI is calculated
- Understanding the Stochastic RSI scale
- Overbought and oversold levels
- The %K and %D lines
- Bullish and bearish crossovers
- Momentum shifts
- Stochastic RSI divergences
- Stochastic RSI during trending markets
- Stochastic RSI during sideways markets
- Combining Stochastic RSI with market structure
- Combining Stochastic RSI with volume and other indicators
- Common mistakes
- Strengths
- Limitations
- How crypto traders use Stochastic RSI
What Is Stochastic RSI?
Stochastic RSI is a technical momentum indicator designed to measure the position of the Relative Strength Index within its recent range.
This distinction is important.Traditional RSI measures momentum based on recent price gains and losses.
Stochastic RSI applies the stochastic formula to RSI values themselves.
In simple terms, the indicator asks:
Is the current RSI relatively high or low compared with where RSI has recently traded?
This makes Stochastic RSI an indicator of an indicator.
Because it analyzes changes within RSI rather than price directly, it generally reacts faster than traditional RSI.
This increased sensitivity allows traders to identify potential short-term momentum changes earlier.
However, it also increases the probability of false signals.
How Does Stochastic RSI Work?
Stochastic RSI compares the current RSI reading with the highest and lowest RSI readings over a selected lookback period.
Suppose RSI has fluctuated between 35 and 70 during the recent period.
If the current RSI approaches 70, Stochastic RSI moves toward the top of its range.
If RSI approaches 35, Stochastic RSI moves toward the bottom.
The indicator therefore does not ask whether Bitcoin, Ethereum or another cryptocurrency is historically expensive or cheap.
Instead, it measures where current momentum sits relative to recent momentum.
This makes Stochastic RSI particularly sensitive to changes in short-term market conditions.
Even relatively small changes in momentum can cause the indicator to move rapidly.
Stochastic RSI vs Traditional RSI
RSI and Stochastic RSI are closely related, but they should not be interpreted as identical indicators.
Relative Strength Index (RSI)
RSI measures the strength of recent price movements.
It is commonly used to identify:
- Momentum.
- Overbought conditions.
- Oversold conditions.
- Divergences.
- Potential changes in trend strength.
Traditional RSI generally moves more slowly and produces fewer extreme readings.
Stochastic RSI
Stochastic RSI measures the position of RSI within its recent range.
Because RSI itself is already a momentum indicator, applying another calculation to RSI creates a much more sensitive oscillator.
Stochastic RSI therefore:
- Moves faster.
- Reaches extremes more frequently.
- Generates more signals.
- Detects short-term momentum changes earlier.
- Produces more false signals.
Neither indicator is automatically better.They serve different purposes.
RSI provides a broader view of momentum.
Stochastic RSI provides a more sensitive view of changes within momentum.
This difference becomes especially important in cryptocurrency markets, where rapid price movements can cause Stochastic RSI to change direction repeatedly within relatively short periods.
How Is Stochastic RSI Calculated?
The basic Stochastic RSI formula compares the current RSI with the highest and lowest RSI values over a selected period.
The formula is:
Stochastic RSI = (Current RSI − Lowest RSI) / (Highest RSI − Lowest RSI)
A common configuration uses a 14-period RSI together with a 14-period Stochastic RSI lookback.
For example, suppose that over the selected lookback period:
Highest RSI = 75
Lowest RSI = 35
Current RSI = 65
First, subtract the lowest RSI from the current RSI:
65 − 35 = 30
Next, calculate the total RSI range:
75 − 35 = 40
Then divide the two values:
30 / 40 = 0.75
The Stochastic RSI reading is therefore 0.75, meaning the current RSI is 75% of the way from the lowest RSI reading to the highest RSI reading within the selected period.
When expressed on a 0–100 scale, the same reading is 75.
Both formats represent the same relative position within the range.
Traders do not normally calculate Stochastic RSI manually.
Charting platforms perform the calculation automatically.
However, understanding the formula explains why the indicator moves much faster than traditional RSI.
Understanding the Stochastic RSI Scale
Stochastic RSI normally oscillates between:
0 and 1
or, depending on the charting platform:
0 and 100
The interpretation remains identical.
A reading near the top of the range indicates that RSI itself is trading near the highest levels seen during the selected lookback period.
A reading near the bottom indicates that RSI is near the lowest levels of its recent range.
Two levels receive particular attention:
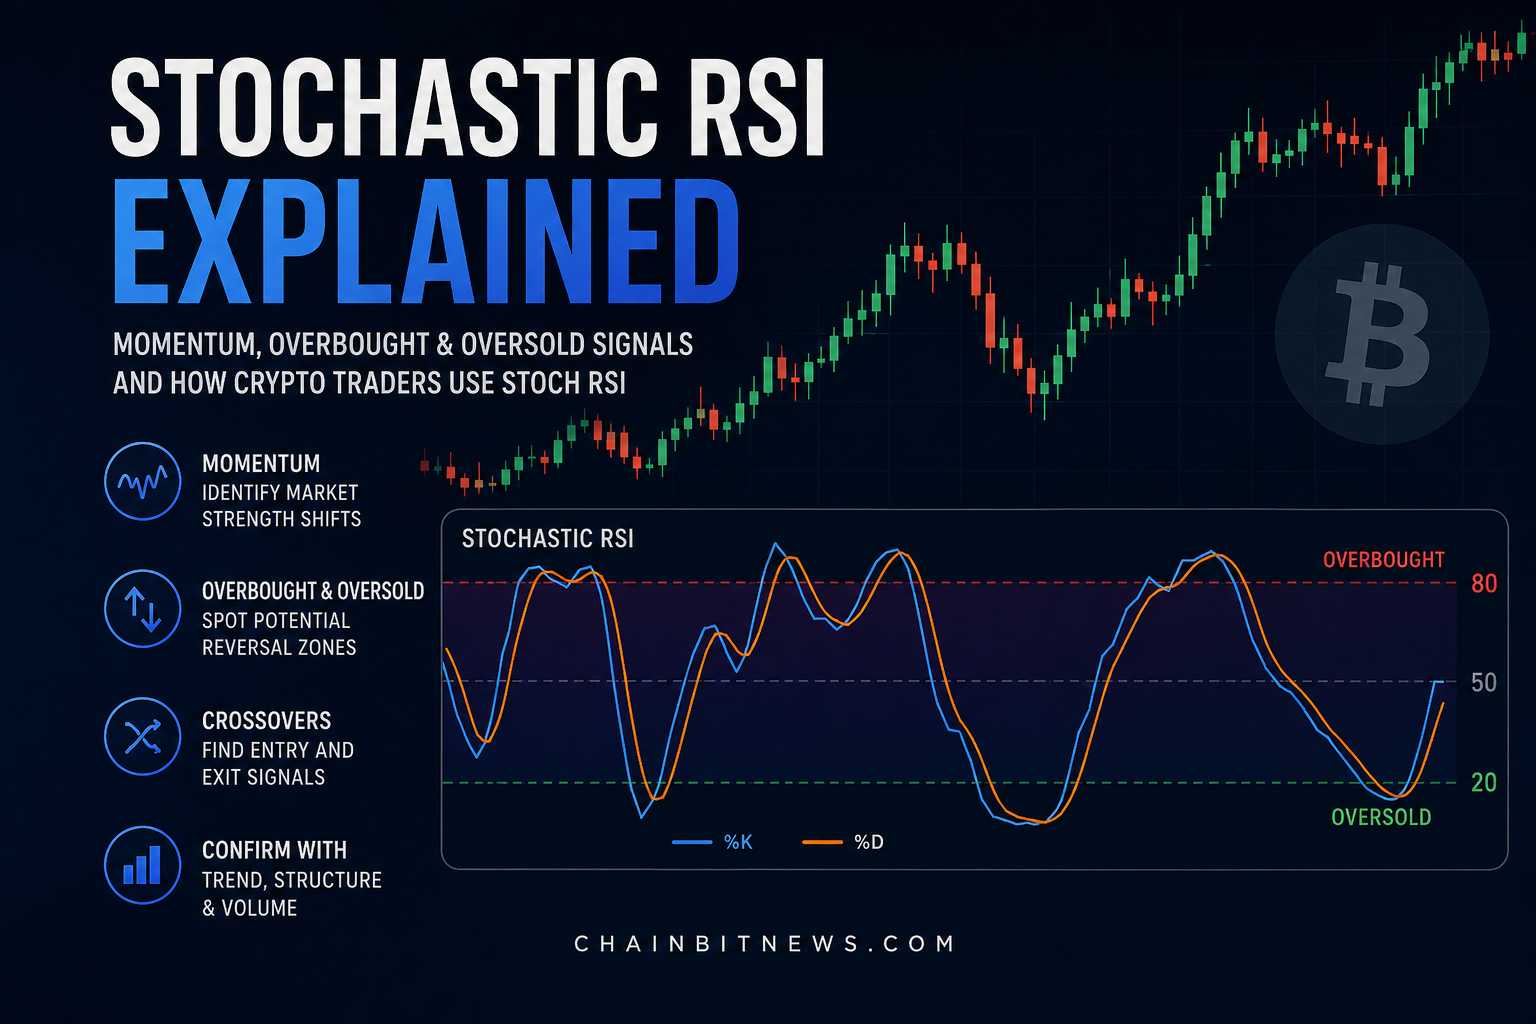
Above 0.80 / 80 = Overbought
Below 0.20 / 20 = Oversold
However, these terms are frequently misunderstood.
Overbought does not automatically mean price must fall.
Oversold does not automatically mean price must rise.
During powerful trends, Stochastic RSI can remain near extreme levels while price continues moving in the same direction.
The indicator therefore provides information about momentum—not guaranteed reversal signals.
Overbought and Oversold Signals
Overbought and oversold readings are among the most common ways traders use Stochastic RSI.
Overbought
When Stochastic RSI rises above 0.80 or 80, short-term momentum is considered relatively strong.
This can indicate that buying pressure has accelerated.
Some traders interpret this as a warning that momentum may eventually weaken.
However, selling purely because Stochastic RSI becomes overbought can be dangerous.
During strong bull markets, the indicator may repeatedly enter overbought territory while prices continue establishing higher highs.
Oversold
When Stochastic RSI falls below 0.20 or 20, short-term momentum is relatively weak.
This may indicate that selling pressure has accelerated.
But oversold conditions do not guarantee a recovery.
During strong downtrends, Stochastic RSI can repeatedly become oversold while prices continue establishing lower lows.
For this reason, overbought and oversold readings should always be interpreted within the broader market structure.
The %K and %D Lines
Stochastic RSI is often displayed using two lines:
%K
and
%D
These lines help traders interpret short-term changes in momentum.
%K Line
The %K line represents the faster component of the indicator.
It reacts more quickly to changes in Stochastic RSI and therefore tends to move first.
%D Line
The %D line is a smoothed version of %K.
Because it moves more slowly, traders often use it as a signal line.
The relationship between these two lines can help identify potential changes in short-term momentum.
Bullish and Bearish Crossovers
One of the most commonly watched Stochastic RSI signals occurs when the %K and %D lines cross.
Bullish Crossover
A bullish crossover occurs when the faster %K line moves above the %D line.
When this occurs near or below the oversold region, traders may interpret it as evidence that downward momentum is weakening and buying pressure is beginning to return.
The signal may become more meaningful when it appears alongside:
- Strong support.
- Increasing volume.
- Improving market structure.
- A higher low.
- A broader bullish trend.
Bearish Crossover
A bearish crossover occurs when %K falls below %D.
When this happens near or above the overbought region, it may indicate that upward momentum is beginning to weaken.
Again, confirmation matters.
A bearish crossover near major resistance with declining volume may provide more useful information than the same crossover occurring randomly in the middle of a strong uptrend.
This is one of the most important principles when using Stochastic RSI:
The indicator provides context—not certainty.
Because Stochastic RSI is extremely sensitive, crossovers occur frequently.
Treating every crossover as an automatic buy or sell signal can lead to excessive trading and repeated false signals.
The strongest applications therefore combine Stochastic RSI with the broader structure of the cryptocurrency market.
Momentum Shifts and Stochastic RSI
One of the primary purposes of Stochastic RSI is identifying changes in momentum.
Price does not always reverse immediately when momentum begins weakening.
Instead, momentum can change before the broader market structure becomes visibly different.
Stochastic RSI attempts to capture these changes quickly.
For example, during an upward move:
- Price continues rising.
- RSI remains relatively strong.
- Stochastic RSI begins declining.
- %K crosses below %D.
- Short-term momentum weakens.
This does not automatically mean the trend will reverse.
The market may simply be experiencing a temporary correction before continuing higher.
The same principle applies during declines.
Stochastic RSI may begin recovering from oversold levels even while price remains weak.
This can indicate improving short-term momentum, but confirmation from price action remains important.
For this reason, Stochastic RSI is best viewed as an early momentum indicator rather than a standalone reversal indicator.
Stochastic RSI Divergences
Divergence occurs when price and an indicator begin moving in different directions.
Traders sometimes use Stochastic RSI divergences to identify potential changes in momentum.
There are two primary types.
Bullish Divergence
A bullish divergence can occur when:
Price creates a lower low
while
Stochastic RSI creates a higher low
This suggests that price continues falling while downward momentum may be weakening.
A bullish divergence becomes more interesting when it develops near:
- Major support.
- Previous market lows.
- Important liquidity zones.
- Oversold market conditions.
However, divergence alone does not guarantee that price will reverse.
Strong downtrends can produce multiple bullish divergences before a meaningful recovery develops.
Bearish Divergence
A bearish divergence can occur when:
Price creates a higher high
while
Stochastic RSI creates a lower high
This may suggest that price continues rising while underlying momentum is weakening.
The signal can become more significant when it occurs near major resistance or after an extended rally.
Again, divergence should be treated as a warning rather than automatic confirmation of a reversal.
Stochastic RSI During Trending Markets
Market conditions significantly influence how Stochastic RSI should be interpreted.
During strong trends, traditional overbought and oversold signals become less reliable.
Imagine Bitcoin is establishing:
- Higher highs.
- Higher lows.
- Strong trading volume.
- Increasing institutional demand.
Stochastic RSI may repeatedly enter overbought territory.
Selling every time the indicator moves above 80 could cause an investor to exit repeatedly during a powerful uptrend.
The opposite occurs during strong bear markets.
Stochastic RSI may become oversold many times while price continues declining.
This demonstrates why the broader trend should generally receive greater importance than an isolated oscillator reading.
During trending markets, traders often focus more on momentum resets.
For example, during an established uptrend, Stochastic RSI may fall from overbought conditions toward oversold territory while price continues holding above important support.
If momentum subsequently turns higher again, the movement may represent trend continuation rather than a complete market reversal.
Stochastic RSI During Sideways Markets
Stochastic RSI can behave differently during sideways or range-bound markets.
When price repeatedly moves between established support and resistance levels, momentum oscillators may become more useful.
For example:
Price approaches support.
Stochastic RSI becomes oversold.
Momentum begins turning higher.
This combination may provide additional evidence that buyers are returning near the lower part of the range.
Near resistance, the opposite may occur.
Price approaches the upper boundary.
Stochastic RSI becomes overbought.
Momentum begins weakening.
This may indicate that sellers are becoming more active.
Because sideways markets naturally oscillate between support and resistance, Stochastic RSI can sometimes provide clearer signals than during powerful directional trends.However, ranges eventually break.
Once a new trend begins, strategies based purely on overbought and oversold conditions can quickly become unreliable.
Combining Stochastic RSI With Market Structure
Market structure provides some of the most important context for interpreting Stochastic RSI.
Rather than asking:
“Is Stochastic RSI overbought?”
a trader might ask:
“Where is price within the broader market structure while Stochastic RSI is overbought?”
That distinction matters.
Consider two scenarios.
Scenario One
Bitcoin is:
- Establishing higher highs.
- Holding higher lows.
- Trading above important support.
- Experiencing strong demand.
Stochastic RSI reaches overbought territory.
This may simply confirm strong bullish momentum.
Scenario Two
Bitcoin approaches major resistance after an extended rally.
Volume begins declining.
Price struggles to establish another high.
Stochastic RSI enters overbought territory and produces a bearish crossover.
The same Stochastic RSI reading now carries very different context.
This is why professional technical analysis rarely depends on a single indicator.
Market structure determines the environment.
Indicators provide additional information within that environment.
Understanding Crypto Market Structure – Part 1 Who Actually Moves the Crypto Market?
Combining Stochastic RSI With Volume
Volume can provide additional confirmation when interpreting momentum signals.
Suppose Stochastic RSI produces a bullish crossover near an important support level.
If trading volume simultaneously begins increasing, the signal may carry greater significance because market participation is also expanding.
Conversely, if Stochastic RSI turns bullish while volume remains extremely weak, the momentum shift may have less conviction.
Traders therefore sometimes evaluate:
- Stochastic RSI direction.
- Trading volume.
- Price structure.
- Support and resistance.
together rather than independently.
This approach reduces reliance on any single technical signal.
Volume Analysis in Crypto: Market Participation, Trend Strength & Why Volume Matters
Combining Stochastic RSI With Other Indicators
Stochastic RSI can also be combined with other technical indicators.
Common combinations include:
Moving Averages
Moving averages can help identify the broader trend while Stochastic RSI measures short-term momentum.
For example, traders may prioritize bullish Stochastic RSI signals when price remains above an important long-term moving average.
RSI
Using RSI alongside Stochastic RSI can provide two different perspectives on momentum.
RSI shows broader momentum conditions.
Stochastic RSI shows where that RSI currently sits relative to its recent range.
MACD
MACD can help evaluate trend momentum while Stochastic RSI identifies faster short-term changes.
Because Stochastic RSI reacts more quickly, it may signal a momentum shift before MACD responds.
Bollinger Bands
Bollinger Bands measure volatility and relative price positioning.
A Stochastic RSI extreme occurring near an outer Bollinger Band may provide additional context, particularly in range-bound markets.
However, adding more indicators does not automatically improve analysis.
Using several indicators that measure nearly the same thing can create unnecessary complexity.
The objective is confirmation—not collecting as many signals as possible.
Common Stochastic RSI Mistakes
Stochastic RSI’s sensitivity makes it useful, but also easy to misuse.
Several mistakes appear frequently.
Treating Overbought as an Automatic Sell Signal
An overbought reading means momentum is near the upper end of its recent range.
It does not mean price must decline.
Strong trends can remain overbought for extended periods.
Treating Oversold as an Automatic Buy Signal
Oversold conditions do not guarantee a market bottom.
Prices can continue falling while Stochastic RSI repeatedly reaches extreme lows.
Trading Every Crossover
Because %K and %D move quickly, crossovers occur frequently.
Trading every crossover can lead to excessive trading and numerous false signals.
Ignoring Market Structure
A bullish signal during a strong downtrend is very different from a bullish signal near support within an established uptrend.
Context matters.
Using Extremely Short Timeframes
Stochastic RSI becomes particularly noisy on very short timeframes.
Small price fluctuations can create rapid changes in the indicator without representing meaningful changes in the broader market.
Relying on Stochastic RSI Alone
No technical indicator can consistently predict future cryptocurrency prices.
Stochastic RSI becomes more useful when combined with market structure, volume, trend analysis and disciplined risk management.
Strengths of Stochastic RSI
Stochastic RSI offers several advantages.
These include:
- High sensitivity to momentum changes.
- Earlier signals than traditional RSI.
- Clear overbought and oversold zones.
- Useful %K and %D crossovers.
- Potential divergence signals.
- Strong compatibility with range-bound markets.
- Easy integration with other technical indicators.
- Applicability across different cryptocurrencies and timeframes.
Its greatest strength is speed.
Because Stochastic RSI responds quickly to changes in RSI momentum, traders may identify developing shifts earlier than with slower indicators.
Limitations of Stochastic RSI
The same sensitivity that makes Stochastic RSI useful also creates its greatest weakness.
The indicator produces substantial noise.
During volatile cryptocurrency markets, Stochastic RSI may move from oversold to overbought and back again without any significant change in the broader trend.
Other limitations include:
- Frequent false signals.
- Excessive crossovers.
- Poor standalone reliability.
- Reduced usefulness during powerful trends.
- Dependence on chosen settings and timeframe.
- Lagging characteristics inherited from RSI.
- Greater risk of overtrading.
Stochastic RSI should therefore not be treated as a prediction tool.
It measures momentum conditions based on historical data.
It cannot know what the market will do next.
Conclusion
Stochastic RSI is one of the most sensitive momentum indicators used in cryptocurrency technical analysis.
Unlike traditional RSI, which measures momentum directly from price movements, Stochastic RSI measures where RSI sits relative to its own recent range.
This additional layer makes the indicator faster and more responsive.
It can help traders identify:
- Momentum shifts.
- Overbought conditions.
- Oversold conditions.
- %K and %D crossovers.
- Potential divergences.
However, greater sensitivity comes with greater noise.
Overbought does not automatically mean sell.
Oversold does not automatically mean buy.
And a crossover does not guarantee a reversal.
The broader market environment remains essential.
When Stochastic RSI is combined with market structure, support and resistance, volume and trend analysis, it can provide valuable insight into changing momentum.
Used alone, it can easily encourage excessive trading.
For crypto traders, the real value of Stochastic RSI therefore lies not in predicting the next price movement—but in understanding how short-term momentum is changing within the broader market structure.
Fibonacci Retracement Explained: Support, Resistance & Why Crypto Traders Use Fibonacci Levels
Disclaimer: This article is for educational and informational purposes only and does not constitute financial or investment advice. Technical indicators cannot predict future market movements with certainty. Cryptocurrency markets are highly volatile and involve significant risk. Always conduct your own research and consider broader market conditions before making investment decisions.