
Cryptocurrency markets often appear chaotic.
Prices surge higher.
Corrections develop suddenly.
Support levels emerge seemingly out of nowhere.
Resistance zones repeatedly stop rallies.
Many traders attempt to understand these movements using technical indicators.
One of the most widely used tools in technical analysis is the Fibonacci Retracement.
Supporters believe Fibonacci levels can help identify potential areas where price may pause, reverse, or continue a trend.
Critics argue that Fibonacci works primarily because so many traders watch the same levels.
Regardless of opinion, Fibonacci Retracement remains one of the most popular tools in financial markets.
Today, it is used across:
- Bitcoin
- Ethereum
- altcoins
- stocks
- forex
- commodities
Understanding how Fibonacci works can help investors better interpret market structure and identify potential support and resistance zones.
In This Analysis, We’ll Explore:
- what Fibonacci Retracement is
- where Fibonacci ratios come from
- how Fibonacci levels are calculated
- the most important Fibonacci ratios
- support and resistance using Fibonacci
- Fibonacci during uptrends and downtrends
- Fibonacci Extensions explained
- common trader mistakes
- how professional traders use Fibonacci
- the strengths and limitations of Fibonacci analysis
What Is Fibonacci Retracement?
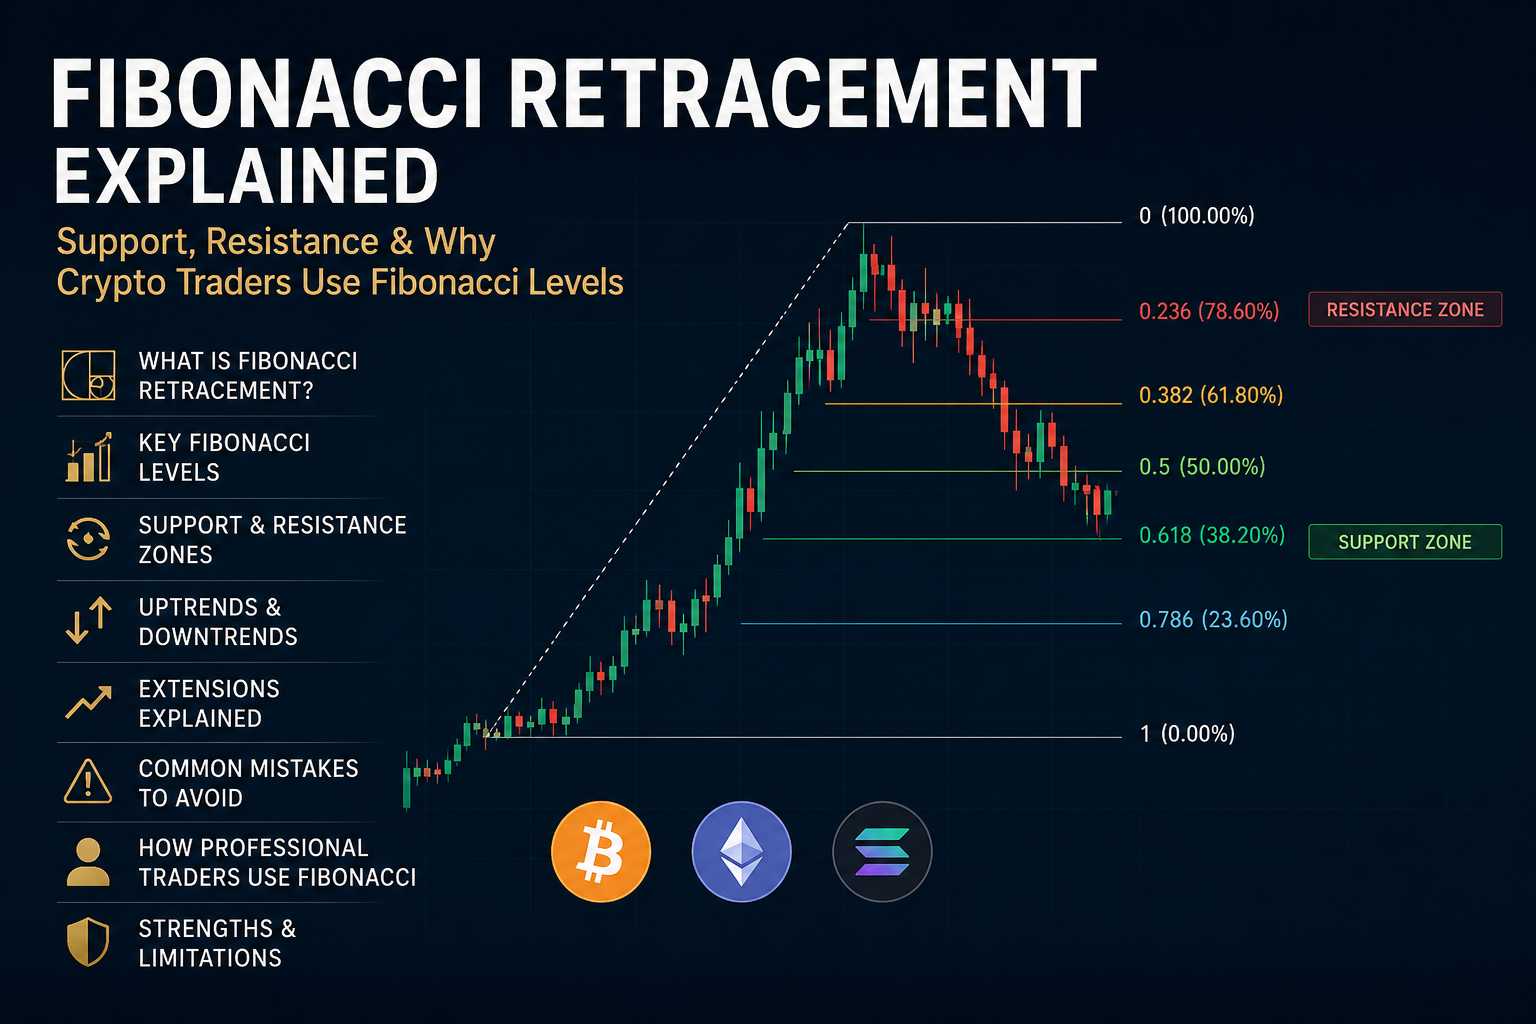
Fibonacci Retracement is a technical analysis tool used to identify potential support and resistance levels during a trend.
The indicator measures how far price retraces after a major move.
For example:
- Bitcoin rallies from $50,000 to $70,000
- the market begins correcting
- traders use Fibonacci levels to estimate potential support zones
Rather than predicting exact prices, Fibonacci provides areas where market participants may become active.
These areas often coincide with:
- profit-taking
- new buying activity
- short covering
- trend continuation
- support and resistance zones
Because of this, Fibonacci is often viewed as a market structure tool rather than a prediction tool.
Where Fibonacci Ratios Come From
The Fibonacci sequence is a mathematical pattern discovered by the Italian mathematician Leonardo Fibonacci.
The sequence begins:
1
1
2
3
5
8
13
21
34
55
89
144
As numbers increase, certain ratios repeatedly emerge.
These ratios form the foundation of Fibonacci Retracement analysis.
The most important ratios include:
- 23.6%
- 38.2%
- 50%
- 61.8%
- 78.6%
Among these, the 61.8% level is often called the Golden Ratio.
Many traders consider it one of the most important levels in technical analysis.
Why Traders Use Fibonacci Levels
Markets rarely move in straight lines.
Even strong trends experience:
- pullbacks
- consolidations
- corrections
- temporary reversals
The challenge is determining where these pullbacks might end.
Fibonacci attempts to identify areas where buyers or sellers may re-enter the market.
Supporters believe these levels work because:
- traders monitor them globally
- algorithms incorporate them
- institutional traders watch them
- market psychology creates self-fulfilling behavior
Whether the effect is mathematical or psychological remains debated.
However, Fibonacci levels continue appearing across financial markets.
The Most Important Fibonacci Levels
23.6%
A shallow retracement.
Often appears during extremely strong trends.
If price only retraces 23.6%, it may indicate strong momentum.
38.2%
A common correction level.
Many healthy trends retrace roughly one-third of the previous move before continuing.
50%
Technically not a Fibonacci ratio.
However, traders frequently include it because markets often retrace approximately half of a move.
61.8%
The Golden Ratio.
One of the most closely watched levels in financial markets.
Many traders view this as a critical support or resistance zone.
78.6%
A deep retracement.
Price has corrected significantly but the original trend may still remain intact.
Fibonacci Retracement in Uptrends
During an uptrend:
- traders identify a significant swing low
- traders identify a significant swing high
- Fibonacci levels are drawn between those points
Potential support zones then appear.
For example:
Bitcoin rallies from:
$60,000 → $80,000
A correction develops.
Traders may watch:
- 38.2%
- 50%
- 61.8%
for signs of:
- buying pressure
- trend continuation
- support formation
This is one of the most common applications of Fibonacci Retracement.
Fibonacci Retracement in Downtrends
The same concept works in reverse.
During a downtrend:
- traders identify the swing high
- traders identify the swing low
- Fibonacci levels project potential resistance
These areas may attract:
- profit-taking
- short positions
- seller activity
- trend continuation
This allows traders to estimate where rallies may struggle before continuing lower.
Fibonacci and Support & Resistance
One reason Fibonacci remains popular is that it often overlaps with traditional support and resistance levels.
For example:
A 61.8% retracement may align with:
- previous support
- psychological price levels
- liquidity zones
- moving averages
When multiple signals converge, traders often view the level as more significant.
This concept is known as confluence.
Professional traders frequently search for confluence rather than relying on a single indicator.
Fibonacci Extensions Explained
While retracements measure pullbacks, Fibonacci Extensions estimate potential future targets.
Common extension levels include:
- 127.2%
- 161.8%
- 261.8%
Traders often use extensions for:
- profit targets
- breakout projections
- trend continuation analysis
For example:
If Bitcoin breaks above resistance, Fibonacci Extensions may help estimate potential upside objectives.
This makes Fibonacci useful beyond support and resistance analysis.
Why Fibonacci Sometimes Appears Surprisingly Accurate
Many investors notice that price occasionally reverses almost perfectly at Fibonacci levels.
This often creates the impression that Fibonacci predicts the future.
In reality, several factors may contribute:
- widespread trader usage
- algorithmic trading systems
- institutional monitoring
- self-fulfilling behavior
- overlapping support and resistance
Markets are ultimately driven by human behavior.
If enough participants react to the same levels, those levels can become important regardless of the underlying mathematics.
Common Fibonacci Mistakes
Many traders misuse Fibonacci.
Common mistakes include:
- drawing levels from insignificant price swings
- treating Fibonacci as a prediction tool
- ignoring market structure
- using Fibonacci without confirmation
- forcing Fibonacci levels onto random charts
- relying exclusively on one indicator
Fibonacci should complement analysis.
It should not replace it.
How Professional Traders Use Fibonacci
Professional traders rarely use Fibonacci in isolation.
Instead, they combine it with:
- market structure
- support and resistance
- volume analysis
- trend analysis
- liquidity zones
- moving averages
- price action
The key question is not:
“Will Fibonacci predict the next move?”
Instead, professionals ask:
“Does this Fibonacci level align with other important market signals?”
This creates a far more robust analytical framework.
Strengths of Fibonacci Analysis
Advantages include:
- simple to use
- widely recognized
- effective for identifying key zones
- useful in trending markets
- works across multiple asset classes
- complements market structure analysis
These strengths explain why Fibonacci remains popular decades after its introduction.
Limitations of Fibonacci Analysis
Despite its popularity, Fibonacci has limitations.
These include:
- subjective swing selection
- false signals
- inconsistent reactions
- limited usefulness in ranging markets
- dependence on trader interpretation
No Fibonacci level guarantees a reversal.
Markets remain influenced by:
- liquidity
- sentiment
- macroeconomics
- institutional positioning
- unexpected events
Because of this, Fibonacci should always be used within broader market analysis.
Conclusion
Fibonacci Retracement remains one of the most widely used technical analysis tools in cryptocurrency markets.
Rather than predicting exact prices, Fibonacci helps traders identify potential areas where support, resistance, and trend continuation may develop.
Understanding:
- Fibonacci ratios
- retracement levels
- extension levels
- market structure
- support and resistance
- trader psychology
can help investors interpret price behavior more effectively.
Successful traders rarely rely on Fibonacci alone.
Instead, they combine Fibonacci with broader analysis involving liquidity, market structure, volume, and price action.In cryptocurrency markets, Fibonacci is best viewed as a framework for identifying probabilities rather than predicting certainties.
For investors seeking a deeper understanding of technical analysis, Fibonacci remains one of the most important tools to understand.
Bollinger Bands Explained: Volatility, Market Structure & How Crypto Traders Use Them
RSI Explained in Crypto: How Investors Use the Relative Strength Index
MACD Indicator in Crypto: Understanding Momentum, Trend Strength & Market Reversals
Disclaimer: This article is for educational and informational purposes only and does not constitute financial or investment advice. Cryptocurrency markets are highly volatile and involve substantial risk. Always conduct your own research before making investment decisions.