
Bollinger Bands remain one of the most widely used volatility indicators in cryptocurrency markets.
Unlike indicators focused primarily on momentum or trend direction, Bollinger Bands are designed to measure:
- market volatility
- price expansion and contraction
- overextended conditions
- breakout potential
- market compression
- trend intensity
- mean reversion behavior
Because crypto markets are highly volatile and emotionally driven, Bollinger Bands became especially popular among traders attempting to identify periods of:
- low volatility before major moves
- overheated price conditions
- temporary exhaustion
- breakout environments
- market compression phases
However, Bollinger Bands are frequently misunderstood.
Many inexperienced traders incorrectly assume touching the upper or lower band automatically signals a reversal.
In reality, Bollinger Bands are volatility tools — not predictive buy or sell signals.
Used correctly, they can improve market structure analysis and volatility interpretation.
Used incorrectly, they can create false confidence, overtrading, and poor decision-making during highly emotional market conditions.
In this analysis, we’ll explore:
- what Bollinger Bands are
- how Bollinger Bands work
- volatility and standard deviation
- Bollinger Band squeeze setups
- breakout and expansion behavior
- mean reversion strategies
- trending vs sideways market conditions
- common Bollinger Band mistakes
- how professional investors use Bollinger Bands within broader market frameworks
- the strengths and limitations of Bollinger Band analysis
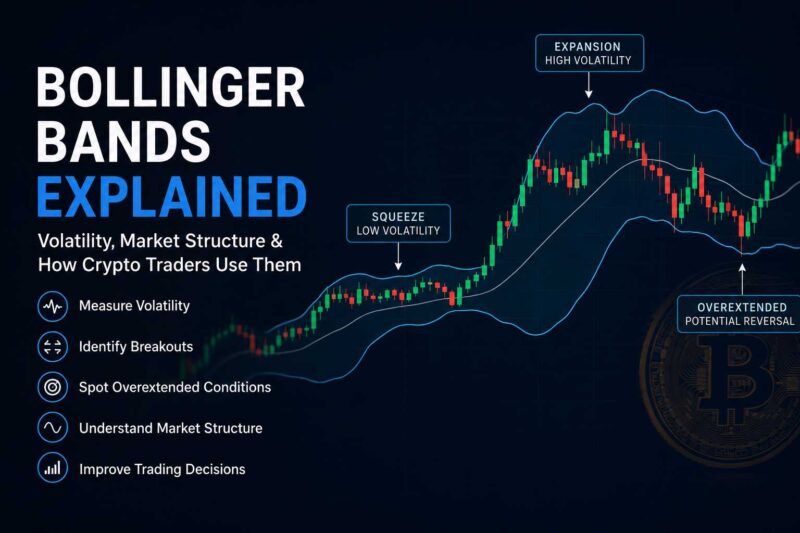
What Are Bollinger Bands?
Bollinger Bands are a volatility-based technical indicator created by John Bollinger.
The indicator consists of three lines:
- a middle moving average
- an upper volatility band
- a lower volatility band
The middle line is typically:
The upper and lower bands expand or contract based on market volatility.
When volatility increases:
- the bands widen
When volatility decreases:
- the bands tighten
Because of this structure, Bollinger Bands help traders visualize changing volatility conditions directly on price charts.
How Bollinger Bands Work
Bollinger Bands are built using standard deviation — a statistical measurement of price dispersion around the moving average.
The default setup is usually:
- 20-period SMA
- 2 standard deviations above and below the average
This creates dynamic bands that adapt to changing market conditions.
In simple terms:
- high volatility = wider bands
- low volatility = tighter bands
This adaptability is one reason Bollinger Bands became extremely popular in both traditional and crypto markets.
Why Volatility Matters in Crypto Markets
Volatility is one of the defining characteristics of cryptocurrency markets.
Unlike traditional financial assets, crypto frequently experiences:
- aggressive price swings
- rapid liquidity shifts
- liquidation cascades
- emotionally driven momentum
- sudden breakout environments
Because volatility constantly changes, traders use Bollinger Bands to identify:
- volatility compression
- potential expansion phases
- overextended price movement
- unstable market conditions
Understanding volatility is often more important than predicting direction itself.
Why Bitcoin Volatility Scares Retail Investors — But Attracts Smart Money
Bollinger Band Squeeze Explained
One of the most popular Bollinger Band concepts is the Bollinger Squeeze.
A squeeze occurs when:
- volatility contracts significantly
- the upper and lower bands tighten
This often signals:
- reduced market activity
- compressed volatility
- potential buildup before expansion
In crypto markets, squeezes frequently occur before:
- major breakouts
- aggressive trend continuation
- sharp volatility expansion
However, Bollinger Bands do not predict direction.
A squeeze only suggests:
- volatility expansion may be approaching
The actual direction depends on:
- liquidity conditions
- market structure
- sentiment
- volume
- broader market context
Bollinger Bands and Breakouts
During strong trends, price may:
- repeatedly ride the upper band in bullish markets
- repeatedly ride the lower band in bearish markets
This is important because many inexperienced traders incorrectly assume touching a band automatically means reversal.
In reality:
- strong trends can remain near outer bands for extended periods
This is especially common during:
- momentum rallies
- panic selloffs
- liquidation-driven volatility
Professional traders often combine Bollinger Bands with:
- volume analysis
- trend structure
- momentum indicators
- liquidity zones
rather than relying on band touches alone.
Mean Reversion and Bollinger Bands
Bollinger Bands are also frequently used for mean reversion analysis.
Mean reversion assumes:
- price eventually returns toward its average over time
Under this framework:
- extreme moves outside the bands may signal temporary exhaustion
For example:
- price far above the upper band may indicate overheated momentum
- price far below the lower band may indicate panic-driven weakness
However, crypto markets frequently remain irrational longer than traders expect.
This makes mean reversion strategies dangerous during strong trending environments.
Trending vs Sideways Markets
Bollinger Bands behave very differently depending on market conditions.
During Trending Markets
Bollinger Bands may show:
- expanding volatility
- sustained band riding
- aggressive momentum continuation
During Sideways Markets
Bollinger Bands often show:
- contracting volatility
- repeated reversals between bands
- mean reversion behavior
- choppy conditions
This distinction is extremely important.
Many indicator failures occur because traders apply mean reversion strategies during strong trends or trend-following strategies during sideways conditions.
Why Sideways Markets Are Where Smart Crypto Investors Win
Common Bollinger Band Mistakes
Many traders misuse Bollinger Bands because they oversimplify the indicator.
Common mistakes include:
- assuming upper band = automatic sell signal
- assuming lower band = automatic buy signal
- ignoring broader trend structure
- trading every squeeze blindly
- relying on indicators without liquidity analysis
- overtrading during sideways markets
Indicators should support analysis — not replace critical thinking.
Bollinger Bands and Market Psychology
Bollinger Bands also reflect crowd psychology.
Periods of tightening bands often represent:
- indecision
- reduced volatility
- emotional compression
- temporary equilibrium
Explosive expansions often reflect:
- fear
- greed
- liquidation pressure
- momentum chasing
- sudden liquidity imbalance
Because millions of traders monitor similar indicators, Bollinger Bands can also become partially self-fulfilling during high-attention market environments.
How Professional Traders Use Bollinger Bands
Professional investors rarely use Bollinger Bands as standalone signals.
Instead, they often combine Bollinger Bands with:
- market structure
- liquidity analysis
- support and resistance
- derivatives positioning
- macro conditions
- volume analysis
- trend confirmation tools
Bollinger Bands are most useful when treated as:
- volatility frameworks
- context indicators
- structural market tools
rather than prediction systems.
Risks and Limitations of Bollinger Bands
Despite their popularity, Bollinger Bands have important limitations.
These include:
- false breakout signals
- lagging behavior
- unreliable reversal assumptions
- weak standalone predictive power
- overuse during sideways markets
Most importantly:
Bollinger Bands react to volatility — they do not predict future price direction.
This distinction is critical.
Indicators can improve structure and discipline, but they cannot eliminate uncertainty or investment risk.
Conclusion
Bollinger Bands remain one of the most widely used volatility indicators in cryptocurrency markets because they help traders visualize changing market conditions and volatility expansion.
Used correctly, Bollinger Bands can improve:
- volatility analysis
- market structure interpretation
- breakout identification
- trend analysis
- emotional discipline
- risk management
However, Bollinger Bands also have significant limitations and should never be viewed as guaranteed predictive tools.
Professional investors typically combine Bollinger Band analysis with:
- liquidity conditions
- trend structure
- macro analysis
- market sentiment
- derivatives positioning
- volume analysis
In highly volatile crypto markets, understanding context matters far more than relying on any single indicator alone.
Ultimately, Bollinger Bands are most effective when used as part of a broader market framework focused on volatility, structure, and risk management — not prediction certainty.
RSI Explained in Crypto: How Investors Use the Relative Strength Index
MACD Indicator in Crypto: Understanding Momentum, Trend Strength & Market Reversals
Bitcoin Weak Phase: Why BTC Can Stay Weak Longer Than Expected
Disclaimer: This article is for educational and informational purposes only and does not constitute financial or investment advice. Cryptocurrency markets are highly volatile and involve substantial risk. Always conduct your own research before making investment decisions.