
Cryptocurrency markets move rapidly.
Prices rise.Prices fall.Breakouts occur.
False breakouts trap investors.
Large rallies sometimes reverse without warning.
Many traders focus almost exclusively on price.
Professional investors, however, often focus on something different.
They want to know whether the current price represents fair value relative to the day’s trading activity.
One of the most widely used tools for answering that question is the Volume Weighted Average Price (VWAP).
Unlike many technical indicators that rely solely on price, VWAP combines both price and trading volume into a single benchmark.
Because institutional investors, hedge funds, algorithmic trading systems and professional traders frequently monitor VWAP, it has become one of the most respected indicators in financial markets.
Supporters view VWAP as one of the best tools for identifying trend direction, institutional activity and high-probability entry opportunities.
Critics point out that VWAP works best during intraday trading and becomes less useful when applied incorrectly across longer timeframes.
Regardless of perspective, VWAP remains one of the most important indicators for understanding how professional market participants evaluate price.
Learning how VWAP works can help investors better interpret market structure, identify dynamic support and resistance, and understand why price often reacts around specific levels throughout the trading session.
In This Analysis, We’ll Explore:
- what VWAP is
- how VWAP is calculated
- why institutional investors use VWAP
- VWAP as dynamic support and resistance
- trend confirmation using VWAP
- pullbacks and mean reversion
- VWAP versus moving averages
- anchored VWAP explained
- Bitcoin vs altcoin VWAP behavior
- common VWAP mistakes
- how professional investors use VWAP
- the strengths and limitations of VWAP analysis
What Is VWAP?
VWAP stands for Volume Weighted Average Price.
It is an indicator that calculates the average price at which an asset has traded throughout the trading session while giving greater importance to periods with higher trading volume.
Unlike a simple average price, VWAP recognizes that not every transaction carries equal significance.
For example:
A few trades executed during a quiet period should not influence the market as much as thousands of trades occurring during periods of heavy activity.
VWAP accounts for this difference.
As a result, it provides a benchmark that reflects where the majority of trading activity has actually occurred.
Because of this, VWAP is widely regarded as one of the most accurate measures of fair intraday value.
Why VWAP Matters
Many technical indicators focus exclusively on price movement.
VWAP incorporates both price and participation.
This distinction is important.
Price shows where the market is trading.
Volume shows how much conviction exists behind those trades.
VWAP combines both into a single reference point.
Professional investors frequently use VWAP to answer questions such as:
- Is price trading above fair value?
- Is the current rally supported by participation?
- Is the market becoming overextended?
- Are buyers or sellers controlling today’s session?
Because these questions are central to institutional trading, VWAP has become one of the most widely followed benchmarks in modern financial markets.
How VWAP Is Calculated
Although charting platforms calculate VWAP automatically, understanding the basic concept helps investors interpret the indicator correctly.
VWAP combines:
- price
- trading volume
- cumulative market activity
Every transaction contributes to the calculation.
Trades executed with higher volume receive greater weighting than trades executed with lower volume.
As the trading session progresses, VWAP continuously updates.
Unlike many moving averages, VWAP does not simply average closing prices.
Instead, it reflects where the largest amount of trading has actually taken place throughout the day.
This makes VWAP fundamentally different from traditional trend indicators.
Volume Analysis in Crypto: Market Participation, Trend Strength & Why Volume Matters
Why Institutional Investors Use VWAP
One reason VWAP has become so influential is its widespread use among institutional investors.
Large investment firms often execute orders worth millions of dollars.
Buying or selling too aggressively can move the market against them.
Instead, institutions frequently attempt to execute trades close to the day’s VWAP.
Doing so helps minimize market impact while achieving prices considered representative of the session.
Many trading desks evaluate execution quality using VWAP.
For example:
If an institution buys Bitcoin below VWAP, the execution may be viewed as favorable.
If the purchase occurs significantly above VWAP, execution quality may be considered weaker.
Because so many institutions monitor the same benchmark, VWAP often becomes self-reinforcing.
Large concentrations of buying and selling activity naturally develop around the indicator.
VWAP as Dynamic Support and Resistance
Support and resistance are often viewed as horizontal price levels.
VWAP introduces a different concept.
Instead of remaining fixed, VWAP moves continuously throughout the trading session.
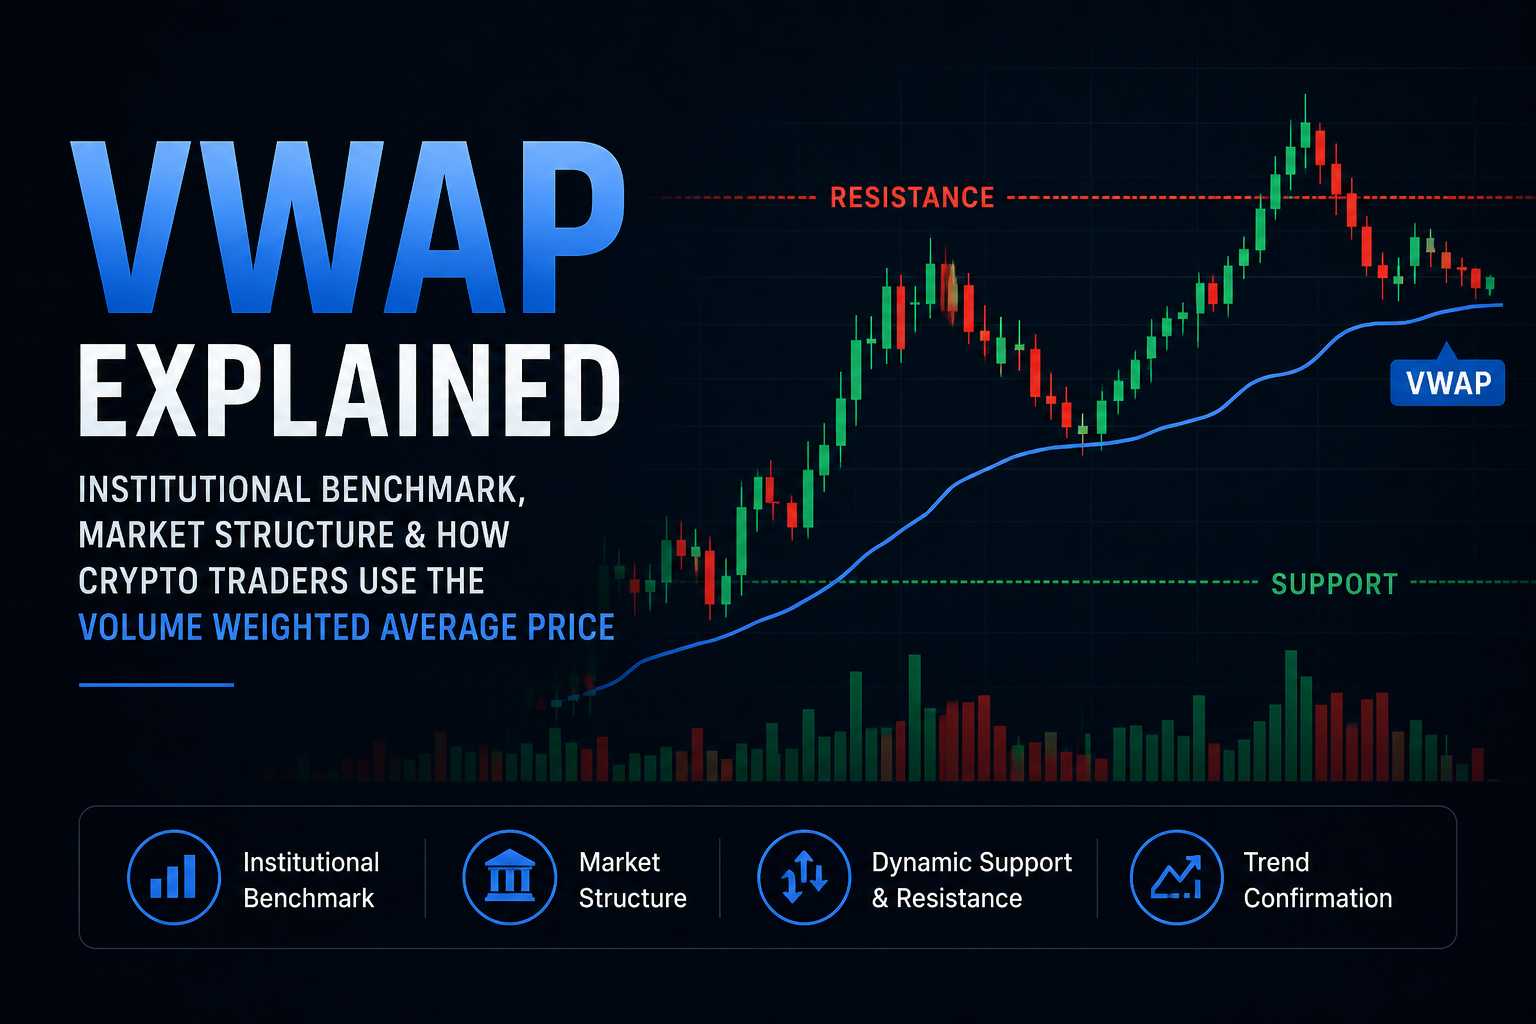
This creates a form of dynamic support and resistance.
During strong uptrends:
Price frequently pulls back toward VWAP before buyers return.
During downtrends:
Price often rallies toward VWAP before sellers regain control.
Because many professional traders monitor these areas, VWAP frequently acts as a decision point where buyers and sellers reassess value.
This behavior makes VWAP particularly useful for identifying potential continuation opportunities.
VWAP and Trend Confirmation
VWAP also helps investors determine whether the market is trending.
Bullish Conditions
Markets trading consistently above VWAP often indicate:
- strong buying pressure
- healthy market participation
- positive momentum
- institutional demand
Although no indicator guarantees future performance, sustained trading above VWAP generally suggests buyers remain in control.
Bearish Conditions
Markets trading below VWAP often indicate:
- persistent selling pressure
- weaker participation from buyers
- declining momentum
- increased downside risk
Professional traders rarely evaluate these signals in isolation.
Instead, they combine VWAP with broader market structure and price action.
Mean Reversion and Pullbacks
Markets rarely move in straight lines.
Even during strong trends, prices periodically move away from fair value before returning.
This concept is known as mean reversion.
VWAP frequently serves as that reference point.
For example:
During a strong rally:
- price accelerates above VWAP
- momentum becomes increasingly stretched
- profit-taking begins
- price retraces toward VWAP
Importantly, returning to VWAP does not automatically indicate weakness.
In many cases, these pullbacks simply allow the market to reset before the broader trend resumes.
Understanding this distinction helps investors avoid confusing normal retracements with genuine trend reversals.
VWAP vs Moving Averages
Because both VWAP and moving averages appear as lines on a chart, many newer investors assume they serve the same purpose.
They do not.
Although both indicators help traders evaluate market trends, they are calculated differently and answer different questions.
Moving Averages
Moving averages calculate the average price over a specific number of periods.
Common examples include:
- 20 EMA
- 50 EMA
- 100 SMA
- 200 SMA
These indicators smooth price action and help identify the overall trend.
However, they only consider price.
Trading volume plays no role in their calculation.
VWAP
VWAP combines:
- price
- trading volume
- cumulative trading activity
This means periods with heavy trading activity have a much greater influence on VWAP than quiet periods.
Because of this, VWAP often provides a more realistic representation of where the market considers fair value during the current trading session.
Professional traders frequently use moving averages to identify the broader trend while simultaneously using VWAP to evaluate whether price is currently trading above or below institutional fair value.
Rather than competing indicators, VWAP and moving averages often complement one another.
Anchored VWAP Explained
Traditional VWAP resets at the beginning of every trading session.
Anchored VWAP works differently.
Instead of starting from the market open, traders manually anchor the calculation to an important event.
Common anchor points include:
- major swing highs
- major swing lows
- earnings announcements
- ETF approvals
- significant news events
- major market crashes
- all-time highs
- cycle bottoms
From that point onward, Anchored VWAP continuously calculates the volume-weighted average price.
This allows investors to measure how market participants have been positioned since a specific event occurred.
Many institutional traders consider Anchored VWAP one of the most valuable tools for identifying long-term support and resistance.
Unlike traditional VWAP, Anchored VWAP remains useful across multiple weeks or even months.
Why Price Often Returns to VWAP
One of the most noticeable characteristics of VWAP is that price frequently revisits it.
This does not happen because VWAP predicts future prices.
Instead, it occurs because markets naturally fluctuate around fair value.
During strong rallies:
buyers become increasingly aggressive.
Eventually, profit-taking begins.
Momentum slows.
Price gradually returns toward the average transaction price represented by VWAP.
The opposite frequently occurs during sharp declines.
Heavy selling pushes price well below VWAP.
As fear subsides, buying pressure often returns and price moves back toward the average.
This behavior explains why many professional traders refer to VWAP as a magnet for price during normal market conditions.
Bitcoin vs Altcoin VWAP Behavior
VWAP behaves differently across various cryptocurrency markets.
Bitcoin
Bitcoin generally benefits from:
- deeper liquidity
- higher trading volume
- stronger institutional participation
- more efficient price discovery
Because of these characteristics, VWAP signals on Bitcoin often appear cleaner and more reliable.
Price frequently respects VWAP during intraday trends, making it one of the most widely used institutional benchmarks for Bitcoin trading.
Am I Too Late to Invest in Bitcoin or Other Cryptocurrencies?
Altcoins
Altcoins often display:
- thinner liquidity
- irregular trading volume
- larger percentage moves
- stronger retail participation
As a result, VWAP reactions on smaller cryptocurrencies may appear less consistent.
Rapid price spikes or sudden liquidity events can temporarily push price far away from VWAP before equilibrium returns.
Investors should therefore interpret VWAP signals within the context of each asset’s liquidity profile.
VWAP and Market Psychology
VWAP is more than a mathematical calculation.
It also reflects collective market behavior.
When price trades significantly above VWAP, many investors begin feeling optimistic.
Momentum traders chase the rally.
Fear of missing out increases.
However, professional investors may simultaneously begin reducing exposure because price has become extended relative to the session’s average.
The reverse often occurs during sharp declines.
Retail investors panic.
Selling accelerates.
Price falls well below VWAP.
Experienced investors may instead begin looking for opportunities if broader market conditions remain constructive.
This difference in behavior explains why VWAP often highlights the contrast between emotional trading and disciplined execution.
Advanced Crypto Investing Strategies – Part 4: Managing Emotions & Avoiding FOMO
Common VWAP Mistakes
Many traders misunderstand how VWAP should be used.
Common mistakes include:
- treating VWAP as a guaranteed support level
- ignoring trading volume
- using VWAP without considering market structure
- assuming every move above VWAP is bullish
- trading against strong higher-timeframe trends
- confusing intraday VWAP with long-term fair value
- relying exclusively on one indicator
VWAP should support decision-making.
It should never replace broader analysis.
How Professional Investors Use VWAP
Professional investors rarely rely on VWAP alone.
Instead, they combine it with multiple forms of analysis.
These include:
- market structure
- support and resistance
- liquidity analysis
- volume analysis
- moving averages
- order flow
- price action
- trend analysis
- macroeconomic conditions
Rather than asking:
“Is price above VWAP?”
Professionals often ask:
“Does VWAP confirm what every other market signal is already suggesting?”
This approach creates a much more robust analytical framework than relying on any single indicator.
Strengths of VWAP Analysis
VWAP offers several important advantages.
These include:
- combines price and volume
- widely followed by institutions
- effective for trend confirmation
- useful for identifying dynamic support and resistance
- helps evaluate execution quality
- highlights market participation
- complements other technical indicators
- applicable across stocks, forex and cryptocurrency markets
These strengths explain why VWAP remains one of the most respected benchmarks in modern trading.
Limitations of VWAP Analysis
Despite its popularity, VWAP has several limitations.
These include:
- primarily designed for intraday analysis
- less useful without sufficient trading volume
- does not predict future prices
- may generate false signals during highly volatile markets
- should not be used in isolation
- does not replace fundamental analysis
Like every technical indicator, VWAP should be interpreted within broader market context.
Successful investing depends on combining multiple forms of analysis rather than relying on any single tool.
Conclusion
VWAP has become one of the most important indicators used by professional traders and institutional investors because it combines two essential components of market behavior: price and volume.
Unlike traditional moving averages, VWAP measures where the majority of trading activity has actually occurred throughout a session, making it a valuable benchmark for identifying fair value, trend strength, and institutional positioning.
Understanding:
- VWAP
- dynamic support and resistance
- trend confirmation
- mean reversion
- Anchored VWAP
- market psychology
- liquidity
- institutional execution
can help investors interpret cryptocurrency markets with greater confidence.
Successful trading is rarely about predicting every market move perfectly.
Instead, it is about understanding whether price action is supported by meaningful market participation.
In cryptocurrency markets, VWAP provides one of the clearest windows into that relationship.
For investors seeking to understand how professional market participants evaluate price, VWAP remains one of the most valuable indicators to master.
Ultimately, VWAP is not simply another line on a chart.
It represents the balance between price, volume, and participation—the three forces that drive every financial market.
Bollinger Bands Explained: Volatility, Market Structure & How Crypto Traders Use Them
MACD Indicator in Crypto: Understanding Momentum, Trend Strength & Market Reversals
Fibonacci Retracement Explained: Support, Resistance & Why Crypto Traders Use Fibonacci Levels
Disclaimer: This article is for educational and informational purposes only and does not constitute financial or investment advice. Cryptocurrency markets are highly volatile and involve substantial risk. Always conduct your own research before making investment decisions.