
Crypto prices can look chaotic.
Bitcoin rallies sharply, suddenly pulls back, trades sideways for several days and then moves again.
Altcoins can behave even more aggressively.
For investors looking at every individual candle, these movements can feel unpredictable.
But when price action is viewed from a wider perspective, patterns begin to appear.
Markets create highs.
Markets create lows.
Those highs and lows form trends.
And those trends eventually strengthen, weaken or break.
This is the foundation of crypto market structure.
Market structure helps investors understand what price is actually doing instead of constantly trying to predict what price will do next.
It can help answer questions such as:
- Is the market trending upward or downward?
- Is price simply consolidating?
- Is a decline a normal pullback or something more significant?
- Has the existing trend started to weaken?
- Which price levels are structurally important?
Market structure cannot predict every market move.False breakouts happen.
Trends fail.Different timeframes can show completely different structures.
But understanding how price forms highs and lows provides a framework for interpreting market behavior without depending entirely on indicators, headlines or sentiment.
In This Analysis, We’ll Explore:
- What crypto market structure is
- Swing highs and swing lows
- Higher highs and higher lows
- Lower highs and lower lows
- Sideways and ranging markets
- Why market structure changes across timeframes
- Higher-timeframe vs lower-timeframe structure
- Pullbacks vs genuine trend reversals
- Break of Structure (BOS)
- Change of Character (CHoCH)
- Failed breakouts and false structure breaks
- Support and resistance
- Liquidity
- Volume confirmation
- Bitcoin and altcoin market structure
- Bull, bear and sideways market conditions
- Market structure vs technical indicators
- Common mistakes
- A simple framework for reading crypto charts
- The limitations of market structure
What Is Crypto Market Structure?
Crypto market structure describes the way price develops through a sequence of highs and lows.
Instead of focusing on one candle, investors examine how important price swings relate to previous ones.
At its simplest, there are three broad environments:
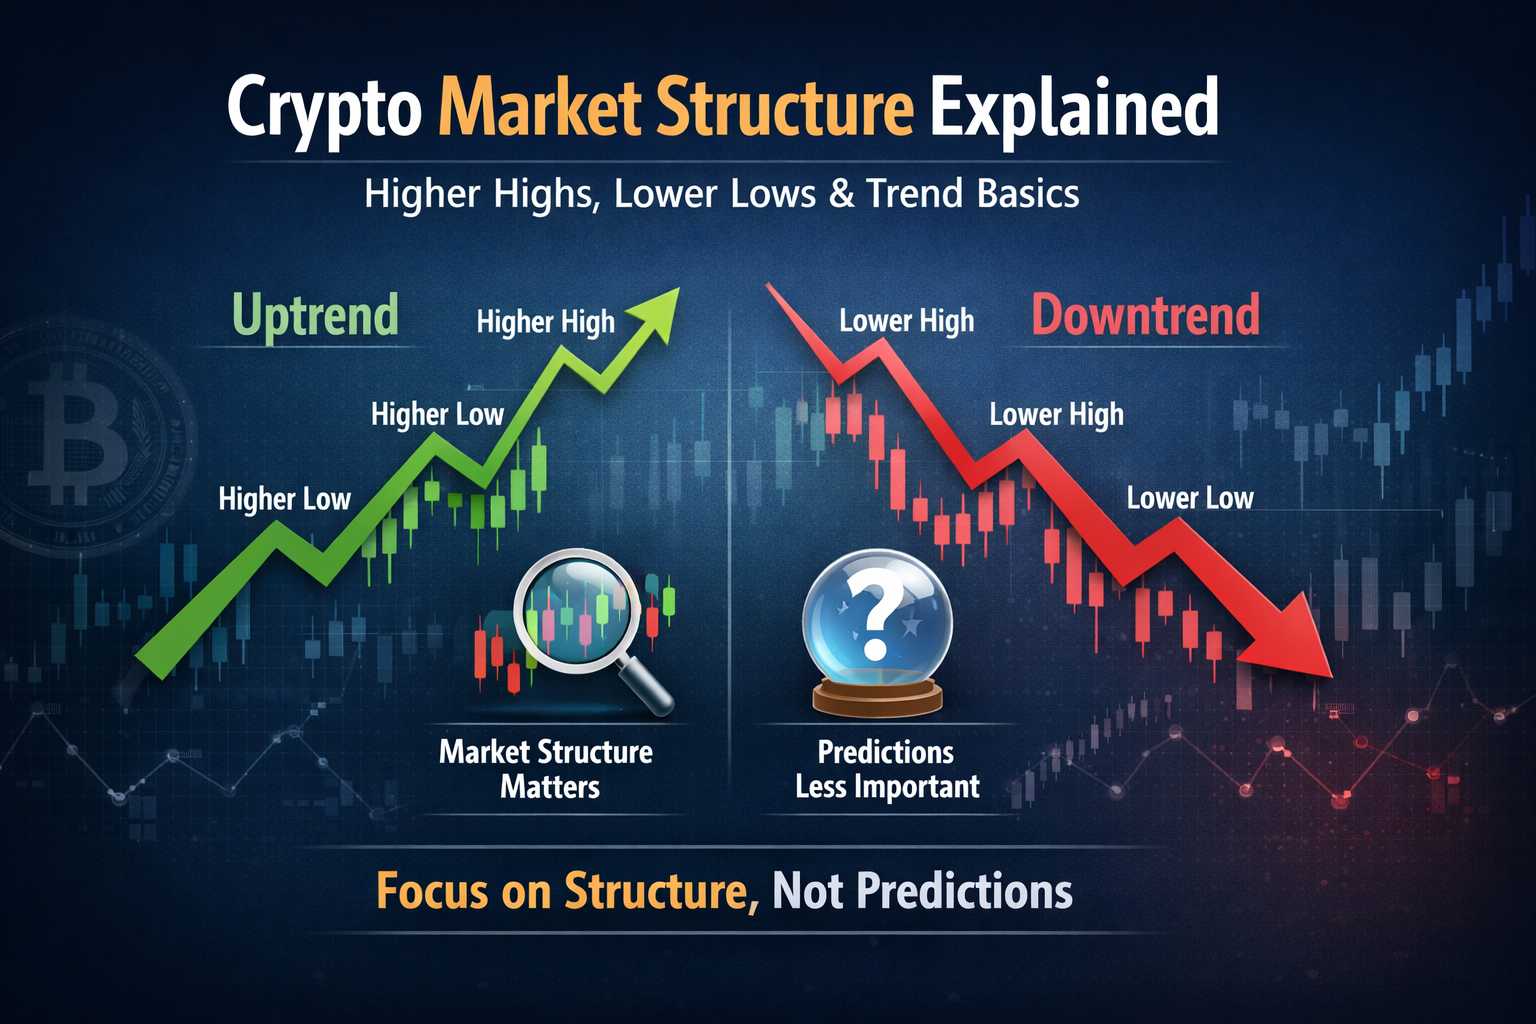
Bullish structure: Price generally produces higher highs and higher lows.
Bearish structure: Price generally produces lower highs and lower lows.
Sideways structure: Price repeatedly trades within a broader range without establishing a sustained directional trend.
This sounds simple.
In practice, however, markets rarely move in perfectly clean patterns.
A bullish market can experience sharp corrections.
A bearish market can produce powerful rallies.
A sideways market can temporarily break above or below its range before returning.
This is why understanding the individual building blocks of market structure is important.
Swing Highs and Swing Lows
Before identifying a trend, investors first need to recognize swing highs and swing lows.
A swing high forms when price reaches a local high before moving lower.
A swing low forms when price reaches a local low before moving higher.
Imagine Bitcoin moves:
$60,000 → $65,000 → $62,000 → $68,000
The $65,000 level represents a swing high.
The subsequent $62,000 level represents a swing low.
Price then moves toward another high.
These turning points create the structure of the market.
Not every tiny movement matters equally.
Crypto charts contain constant fluctuations, especially on lower timeframes.
The objective is to identify the swings that are significant enough to define the broader trend.
Once those swings become visible, investors can begin comparing them.
Higher Highs and Higher Lows
A bullish market structure typically develops through a sequence of:
Higher Highs (HH)
and
Higher Lows (HL).
Imagine price develops like this:
$60,000 → $70,000 → $64,000 → $75,000 → $68,000 → $80,000
The important observation is not that price moved upward every day.
It didn’t.
The market repeatedly corrected.
But each major high exceeded the previous high.
At the same time, each major pullback remained above the previous significant low.
Structurally, this can be represented as:
Higher High → Higher Low → Higher High → Higher Low → Higher High
This tells us that buyers have repeatedly been willing to enter at higher prices.
It also demonstrates an important principle:
Bullish trends require pullbacks.
A market does not need to move continuously upward to remain bullish.
Corrections can occur while the broader structure remains intact.
Why Higher Lows Matter
Investors naturally focus on new highs.
But higher lows can reveal just as much about the health of a trend.
Suppose Bitcoin reaches a new high and then corrects.
If buyers enter before price reaches the previous major low, the market establishes a higher low.
That suggests demand is appearing at a higher price than before.
Repeated higher lows can therefore indicate that buyers remain willing to defend increasingly higher levels.
This is why every correction should not automatically be interpreted as the end of a bullish trend.
The more useful question is:
Has the correction actually damaged the existing structure?
If important higher lows remain intact, the broader bullish trend may still be structurally healthy despite short-term weakness.
Lower Highs and Lower Lows
Bearish market structure works in the opposite direction.
It typically consists of:
Lower Lows (LL)
and
Lower Highs (LH).
Imagine price moves:
$80,000 → $68,000 → $75,000 → $62,000 → $70,000 → $55,000
Price experiences several rallies.
But each major recovery fails below the previous high.
At the same time, sellers repeatedly push price toward new lows.
The structure becomes:
Lower Low → Lower High → Lower Low → Lower High → Lower Low
This indicates that sellers continue gaining control at progressively lower prices.
Why Bear Market Rallies Can Be Misleading
Bearish trends rarely move straight down.
Strong rallies can occur even within clearly declining market structures.
This creates one of the most common psychological traps in crypto.
After a substantial decline, price suddenly rallies 10%, 20% or even more.
Sentiment improves.Investors begin calling the bottom.
But if the rally creates another lower high and price subsequently falls to another lower low, the broader bearish structure never actually changed.
A strong bounce is therefore not automatically a trend reversal.
Investors need to distinguish between:
price moving upward
and
market structure becoming bullish.
Those are two different things.
Sideways and Ranging Market Structure
Markets do not always establish clear directional trends.
Sometimes price repeatedly moves between approximately the same upper and lower boundaries.
This creates a range.
The upper area often functions as resistance.
The lower area often functions as support.
Instead of creating sustained higher highs or lower lows, price rotates between these boundaries.
A simplified range might look like:
Support → Resistance → Support → Resistance → Support
These periods are also commonly described as consolidation.
Ranges can develop:
- After strong rallies.
- After major declines.
- During periods of uncertainty.
- Before larger directional moves.
- When buyers and sellers are relatively balanced.
Sideways markets can last much longer than investors expect.
And importantly:
A range does not tell investors which direction the eventual breakout will take.
The market may break upward.
It may break downward.
Or it may briefly break the range and then return inside.
This is why confirmation becomes important.
Why Market Structure Works on Different Timeframes
Market structure exists on virtually every timeframe.
A chart can be analyzed using:
- Minutes.
- Hours.
- Days.
- Weeks.
- Months.
But this creates an important complication.
The same cryptocurrency can simultaneously be:
Bullish on the 1-hour chart
Sideways on the daily chart
and
Bearish on the weekly chart.
None of these observations necessarily contradict each other.
They simply describe different layers of market structure.
A short-term rally can occur inside a much larger bearish trend.
Likewise, a sharp intraday correction can occur inside a strong long-term bull market.
This is why timeframe selection matters.
Higher-Timeframe vs Lower-Timeframe Structure
Higher timeframes generally provide more information about the broader trend.
Lower timeframes reveal more detail about what is happening inside that trend.
For example, imagine Bitcoin has been creating higher highs and higher lows on the weekly chart for several months.
That establishes a broader bullish structure.
Bitcoin then experiences a correction.
On the 1-hour chart, that correction may create:
Lower High → Lower Low → Lower High → Lower Low
The short-term structure is bearish.
But the weekly structure may remain completely intact.
This is not unusual.
It is simply a bearish move occurring inside a larger bullish trend.
Investors who focus only on lower timeframes can therefore mistake normal volatility for major structural change.
A useful principle is:
Higher timeframes provide context. Lower timeframes provide detail.
The timeframe that matters most depends on the investor’s objective.
A long-term investor generally cares more about weekly and daily structure than what happens over fifteen minutes.
A short-term trader may need much more detailed information.
Market Structure Is Relative to Your Time Horizon
There is no universally correct timeframe.
The relevant timeframe depends on the decision being made.
A long-term investor asking whether Bitcoin remains in a broader bull market should not allow a small hourly breakdown to determine the entire investment thesis.
Likewise, a short-term trader cannot rely exclusively on monthly structure when managing an intraday position.
This is why statements such as:
“Bitcoin’s market structure is bearish”
can be incomplete.
The obvious follow-up question is:
On which timeframe?
Without that context, two analysts can appear to disagree while both are technically describing the market correctly.
Pullbacks vs Trend Reversals
One of the most valuable applications of market structure is distinguishing between a normal pullback and a potential trend reversal.
Suppose an asset is in a bullish trend:
Higher High → Higher Low → Higher High
Price then begins falling.
The decline itself does not immediately invalidate the bullish structure.
Markets naturally retrace.
The important question is what happens around the previous significant higher low.
If price remains above that structural level and subsequently moves toward another higher high, the decline was simply part of the existing trend.
But if price decisively breaks an important higher low, something has changed.
The sequence of higher lows has been interrupted.
That does not automatically guarantee a new bear market.
Price could enter a range.
The breakdown could fail.
Buyers could quickly regain control.
But the previous bullish structure can no longer be treated exactly as before.
This distinction is crucial:
A pullback moves against the trend while preserving important structure.
A potential reversal begins when important structure starts to fail.
And that brings us to the next major part of market structure analysis:
Break of Structure (BOS) and Change of Character (CHoCH).
What Is a Break of Structure (BOS)?
A Break of Structure, commonly called BOS, occurs when price breaks an important previous swing point in the direction of the existing trend.
In a bullish market, price may form:
Higher High → Higher Low → Higher High
After another pullback, price moves above the previous higher high.
That breakout can confirm that the bullish structure is continuing.
In a bearish market, the opposite applies.
Price may form:
Lower Low → Lower High → Lower Low
After a temporary recovery, price breaks below the previous lower low.
This can confirm continuation of the bearish structure.
A BOS therefore generally supports the idea that the existing trend remains intact.
But not every tiny break qualifies as meaningful.
The significance depends on:
- The importance of the previous swing.
- The timeframe.
- How decisively price breaks the level.
- Whether price remains beyond the level.
- Volume and surrounding market conditions.
This is why simply drawing lines through every small high and low can create more confusion than clarity.
What Is a Change of Character (CHoCH)?
A Change of Character, commonly abbreviated as CHoCH, attempts to identify an early change in the behavior of market structure.
Suppose Bitcoin has been trending upward:
Higher High → Higher Low → Higher High → Higher Low
Normally, investors would expect another attempt toward a higher high.
Instead, price falls and breaks below an important previous higher low.
The established bullish sequence has now been interrupted.
This can represent a bearish Change of Character.
The opposite can happen during a downtrend.Imagine:
Lower Low → Lower High → Lower Low → Lower High
Price then rallies above an important lower high.
The bearish sequence has been disrupted.
This can represent a bullish Change of Character.
CHoCH can therefore provide an early indication that market behavior is changing.
But it is important not to overstate what it means.
A CHoCH is not proof that a complete trend reversal has occurred.
It tells investors that the previous structure has weakened enough to deserve attention.
BOS vs CHoCH
The difference can be simplified:
Break of Structure (BOS) → usually confirms continuation of the existing trend.
Change of Character (CHoCH) → suggests the existing trend may be changing.
Imagine a bullish trend.Price breaks above the previous major high.
That supports bullish continuation:
BOS
But if price instead breaks below an important higher low, the behavior has changed.
CHoCH
From there, investors watch what happens next.
Does price recover and reclaim the bullish structure?
Does it begin creating lower highs and lower lows?
Does it move into a range?
Market structure provides information as price develops.
It does not guarantee what the next move will be.
Failed Breakouts and False Structure Breaks
Crypto markets frequently move beyond important levels and then quickly reverse.
This creates false breakouts.
Suppose Bitcoin has repeatedly failed around resistance at $70,000.
Price suddenly moves to $70,800.
At first glance, this appears to be a breakout.
Traders enter.
Short positions may be stopped out.
But Bitcoin quickly falls back below $70,000 and returns inside the previous range.
The breakout failed.
This illustrates why investors should be careful about treating every wick beyond a previous high or low as a structural change.
Depending on the strategy and timeframe, traders may look for additional evidence such as:
- A candle close beyond the level.
- Sustained trading beyond the level.
- Increasing volume.
- A successful retest.
- Follow-through after the breakout.
None of these guarantees success.
But they can help distinguish meaningful structural movement from temporary volatility.
Support and Resistance Within Market Structure
Support and resistance become much more useful when viewed in combination with market structure.
Previous swing lows can become areas where buyers previously entered.
Previous swing highs can become areas where sellers previously appeared.
During a bullish trend, investors may watch previous higher lows as potential support.
During a bearish trend, previous lower highs may become potential resistance.
But these levels should generally be treated as areas rather than exact prices.
Crypto markets are volatile.
Price can briefly move through a level before reversing.
The relationship between support, resistance and structure is therefore more important than expecting price to react perfectly to one line on a chart.
Liquidity and Market Structure
Market structure also helps explain where liquidity may accumulate.
Many traders place orders around obvious structural levels.
For example:
- Stop-losses may sit below previous lows.
- Short stop-losses may sit above previous highs.
- Breakout orders may accumulate above resistance.
- Buy orders may cluster around support.
These concentrations of orders create liquidity.
Price may move toward these areas before reversing or continuing.
This helps explain why crypto sometimes briefly breaks an obvious support or resistance level before moving sharply in the opposite direction.
A move beyond a previous high or low does not automatically confirm a new trend.
Sometimes price is simply interacting with liquidity around an obvious structural level.
This is another reason confirmation matters.
Liquidity in Crypto Markets: Why Capital Flows Move Prices
Volume and Market Structure
Volume can provide additional context when price approaches an important structural level.
Imagine Bitcoin has repeatedly failed to break resistance.
It eventually moves above that level.
A breakout accompanied by strong participation may carry more information than one occurring during extremely weak trading activity.
Likewise, declining volume during a rally can sometimes indicate weakening participation.
But volume should not be treated as an automatic confirmation signal.
High volume can occur during both buying and selling.
Crypto volume also differs between exchanges and markets.
The useful question is not simply:
“Is volume high?”
but:
“How is volume behaving relative to the price structure?”
Market structure remains the framework.
Volume provides additional context.
Volume Analysis in Crypto: Market Participation, Trend Strength & Why Volume Matters
How Bitcoin Influences Altcoin Market Structure
Individual altcoins have their own market structures.
But the broader crypto market does not operate in isolation from Bitcoin.
Bitcoin remains the dominant source of liquidity, attention and market direction across much of the cryptocurrency ecosystem.
An altcoin may show technically bullish structure while Bitcoin begins experiencing significant weakness.
That does not automatically invalidate the altcoin setup.
But broader market risk has increased.
Likewise, strong Bitcoin conditions can provide a more supportive environment for altcoins.
Investors analyzing altcoin structure should therefore consider two levels:
The structure of the individual asset
and
the broader structure of the crypto market.
This is particularly important during periods when correlations increase and large Bitcoin moves affect almost the entire market.
Bitcoin (BTC) Analysis: Liquidity, Market Dominance, Institutional Adoption & Long-Term Positioning
Market Structure During Bull Markets
Bull markets are characterized by broader upward trends, but they still contain corrections.
This is where market structure becomes particularly useful.
Instead of panicking during every decline, investors can ask:
- Is the broader sequence of higher highs intact?
- Are important higher lows holding?
- Has price actually broken major structure?
- Is this weakness occurring only on a lower timeframe?
A 10% correction can look dramatic on a short-term chart while barely affecting the larger trend.
This helps investors separate volatility from structural deterioration.
However, bull markets eventually weaken.
When important higher lows repeatedly fail and rallies stop producing convincing new highs, the structure deserves closer attention.
Market Structure During Bear Markets
Bear markets create the opposite challenge.
Large rallies can create the impression that a recovery has begun.
But price rising does not automatically mean the bearish trend has ended.
Investors should watch whether the market continues producing:
Lower Highs + Lower Lows
If it does, the broader bearish structure remains intact.
A more meaningful change begins when sellers fail to create new lows and buyers start breaking important lower highs.
Even then, the market may transition into consolidation rather than immediately beginning a new bull market.
Trend reversals are often processes rather than single moments.
Market Structure During Sideways Markets
Sideways markets require a different approach.
There may be no clear sequence of higher highs or lower lows.
Instead, price repeatedly moves between support and resistance.
Inside these environments, investors should identify:
- The range high.
- The range low.
- The middle of the range.
- Failed breakout attempts.
- Liquidity around both boundaries.
One of the biggest mistakes is trying to force a directional trend onto a market that is clearly ranging.
Sometimes the correct structural interpretation is simply:
There is no established trend.
That information itself can be valuable.
Market Structure vs Technical Indicators
Market structure and technical indicators answer different questions.
Indicators such as:
transform price or volume data into additional signals.
Market structure looks directly at price behavior.
This makes structure a useful foundation before adding indicators.
For example, an oversold RSI reading inside a strong bearish structure does not automatically mean the trend is reversing.
Likewise, an overbought reading during a strong bullish trend does not automatically mean price has reached a major top.
Indicators become more useful when interpreted within the broader structural environment.
Instead of asking:
“Is RSI oversold?”
an investor might ask:
“Is RSI oversold while price is approaching an important higher-timeframe support level within an otherwise bullish structure?”
Context changes the meaning of the signal.
Common Market Structure Mistakes
Market structure appears simple, but several mistakes can make it misleading.
Common examples include:
- Treating every small high or low as important.
- Ignoring the higher timeframe.
- Assuming every structure break creates a reversal.
- Calling every wick a breakout.
- Confusing a bear market rally with a new bull trend.
- Ignoring support and resistance.
- Forcing a trend onto a sideways market.
- Using structure without considering liquidity.
- Constantly changing the timeframe until it supports an existing opinion.
The last mistake is particularly dangerous.
If an investor wants to be bullish, there will almost always be some timeframe where the chart looks bullish.
Analysis should determine the conclusion.
The desired conclusion should not determine the analysis.
A Simple Framework for Reading Any Crypto Chart
Market structure does not need to become unnecessarily complicated.
When opening a chart, investors can begin with a few questions.
1. Start With the Higher Timeframe
Determine the broader environment.Is price generally:
Trending up?
Trending down?
Moving sideways?
2. Identify Important Swing Highs and Lows
Ignore insignificant noise and focus on the swings defining the broader trend.
3. Compare the Swings
Look for:
Higher Highs + Higher Lows
or
Lower Highs + Lower Lows
or neither.
4. Mark Important Structural Levels
Identify the highs and lows that would meaningfully change the current interpretation if broken.
5. Move to a Lower Timeframe if Necessary
Use lower timeframes for additional detail without forgetting the broader context.
6. Watch How Price Reacts
Do not assume that a level will hold or break.
Observe what price actually does.
This keeps market structure analysis focused on evidence rather than prediction.
Limitations of Crypto Market Structure
Market structure is useful, but it has limitations.
First, identifying significant swing points can be subjective.
Two analysts may select slightly different highs and lows.
Second, structure is inherently reactive.
A structural break becomes visible only after price has already moved.
Third, false breakouts are common.
Crypto’s volatility can temporarily push price beyond important levels before reversing.
Fourth, different timeframes can produce conflicting signals.
Finally, market structure cannot account for every external event.
Unexpected regulatory developments, macroeconomic shocks, security incidents or major liquidations can rapidly change market conditions.
Market structure should therefore be treated as a framework for interpreting price—not as a system capable of predicting every move.
Conclusion
Crypto market structure turns seemingly chaotic price movement into a more understandable sequence of highs, lows, trends and ranges.
The basic concepts are simple:
Higher Highs + Higher Lows → Bullish Structure
Lower Highs + Lower Lows → Bearish Structure
Repeated highs and lows within boundaries → Sideways Structure
From there, investors can examine whether important structural levels continue holding or begin to fail.
Breaks of Structure can support trend continuation.
Changes of Character can provide early evidence that existing behavior is changing.
Support, resistance, liquidity and volume add further context.
But none of these concepts eliminate uncertainty.
A breakout can fail.
A CHoCH can reverse.
A bearish lower-timeframe structure can exist inside a larger bull market.
The objective is therefore not to predict every top and bottom.
It is to understand what the market is currently showing.
That creates a much more useful question than:
“Where will Bitcoin go next?”
Instead ask:
“What would price need to do for the current market structure to change?”
Once investors begin thinking this way, individual candles become less important.
The broader structure becomes the story.
Understanding Crypto Market Structure – Part 4: Derivatives, Leverage and Liquidations
Understanding Crypto Market Structure – Part 3: The Role of Institutions in Crypto
Understanding Crypto Market Structure – Part 2: Liquidity and Why It Controls Volatility

Disclaimer: This article is for educational purposes only and does not constitute financial advice. Cryptocurrency markets are volatile, and all investment decisions carry risk. Always do your own research.