
Cryptocurrency markets are heavily driven by momentum.
Strong rallies can accelerate far beyond expectations, while sudden reversals can erase gains rapidly. Because of this, many investors and traders rely on technical indicators to better understand market strength, momentum shifts, and potential trend reversals.
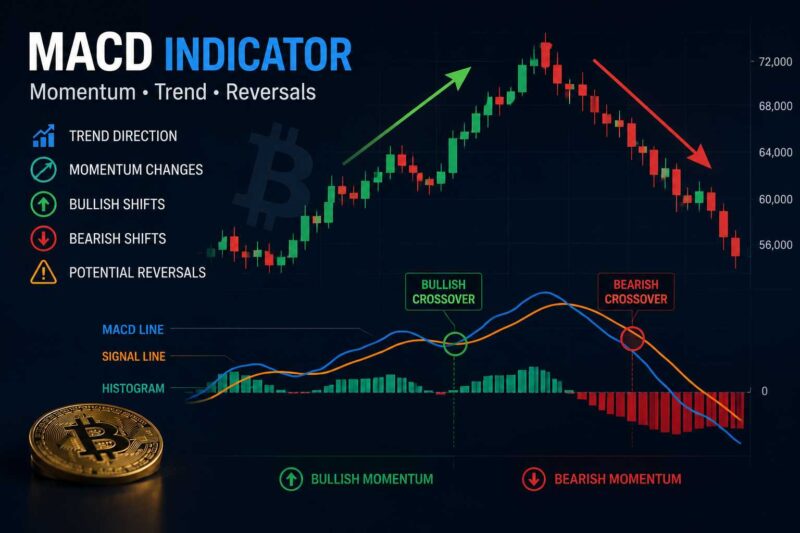
One of the most widely used momentum indicators in both traditional finance and crypto markets is the MACD — short for Moving Average Convergence Divergence.
The MACD is popular because it helps investors identify:
- trend direction
- momentum changes
- bullish and bearish shifts
- weakening market strength
- potential reversals
However, while many beginners treat MACD signals as simple “buy” or “sell” triggers, experienced investors understand that the indicator works best when combined with broader market context, structure, and risk management.
In this article, we’ll explore:
- what the MACD indicator actually measures
- how MACD works in crypto markets
- bullish and bearish crossover signals
- MACD divergence explained
- why MACD sometimes fails
- how investors combine MACD with other indicators
Understanding MACD properly can help investors improve discipline, avoid emotional reactions, and better interpret crypto market momentum.
What Is the MACD Indicator?
The MACD (Moving Average Convergence Divergence) is a momentum-following technical indicator that tracks the relationship between two moving averages.
It was designed to help investors identify:
- momentum strength
- trend direction
- potential reversals
- changes in buying or selling pressure
Unlike some indicators that only measure overbought or oversold conditions, MACD focuses more heavily on momentum and trend behavior.
This makes it especially useful in highly volatile crypto markets where momentum often drives large price movements.
How the MACD Indicator Works
The MACD consists of three main components:
The MACD Line
The MACD line is created by subtracting the:
- 26-period exponential moving average (EMA)
from the:
- 12-period exponential moving average (EMA)
This measures short-term momentum relative to longer-term momentum.
The Signal Line
The signal line is typically a 9-period EMA of the MACD line itself.
This line helps identify momentum shifts and crossover signals.
The Histogram
The histogram visually shows the distance between the MACD line and the signal line.
It helps investors quickly identify whether momentum is:
- strengthening
- weakening
- accelerating
- slowing down
When histogram bars expand, momentum is increasing.
When histogram bars shrink, momentum may be weakening.
Why MACD Is Popular in Crypto Markets
Crypto markets often experience strong trending behavior driven by:
- speculation
- liquidity cycles
- social media narratives
- market psychology
- momentum trading
Because MACD focuses on trend strength and momentum shifts, it adapts well to crypto volatility.
Many investors use MACD to:
- identify trend continuation
- detect weakening rallies
- confirm breakout strength
- spot potential reversals
- reduce emotional decision-making
However, MACD should never be viewed as a guaranteed predictive tool.
Bullish MACD Crossovers
One of the most common MACD signals is the bullish crossover. This occurs when:
- the MACD line crosses above the signal line
This is often interpreted as:
- strengthening momentum
- increasing buying pressure
- possible bullish continuation
Bullish crossovers are especially important when they occur:
- after prolonged corrections
- near support zones
- during improving market sentiment
- alongside rising volume
In strong crypto bull markets, bullish MACD crossovers can sometimes signal the beginning of large momentum expansions.
However, false signals remain common during choppy or sideways markets.
Bearish MACD Crossovers
A bearish crossover occurs when:
- the MACD line crosses below the signal line
This may indicate:
- weakening momentum
- declining buying pressure
- possible trend reversal
- increased downside risk
Bearish crossovers become more important when they appear:
- after aggressive rallies
- near resistance levels
- during weakening volume
- alongside broader market weakness
In crypto markets, bearish crossovers can accelerate fear quickly because sentiment often changes aggressively during volatility.
MACD Divergence Explained
One of the most powerful MACD concepts is divergence.
Divergence occurs when price action and momentum begin moving in different directions.
Bullish Divergence
Bullish divergence occurs when:
- prices make lower lows
- MACD makes higher lows
This may indicate:
- weakening selling pressure
- improving momentum beneath the surface
- possible reversal conditions
Bearish Divergence
Bearish divergence occurs when:
- prices make higher highs
- MACD makes lower highs
This may suggest:
- weakening bullish momentum
- declining trend strength
- increased reversal risk
Divergence is important because momentum often weakens before price fully reverses.
However, divergence alone is not enough to guarantee market direction. Also Read ->
What Actually Moves Crypto Prices? Understanding the Real Market Forces
Why MACD Sometimes Fails
Like all technical indicators, MACD has limitations.
One of the biggest problems with MACD is that it is a lagging indicator. Since it relies on moving averages, signals often appear after major price movement already occurred. This means:
- entries may come late
- reversals may already be underway
- false signals can occur frequently
MACD also struggles during:
- sideways markets
- low volatility conditions
- choppy consolidation phases
During these periods, crossover signals may become unreliable and create excessive noise.
This is why experienced investors rarely rely on MACD alone.
Combining MACD With Other Indicators
Professional investors typically combine MACD with additional forms of analysis.
This helps improve signal quality and reduce false interpretations.
MACD + RSI
Many investors combine MACD with RSI because:
- MACD tracks momentum shifts
- RSI identifies overbought and oversold conditions
Together, they provide a broader picture of market behavior.
MACD + Volume
Strong MACD signals supported by rising volume are often considered more reliable than momentum signals without participation.
Volume helps confirm whether momentum has real market conviction behind it.
MACD + Support and Resistance
MACD becomes more useful when combined with important market structure levels.
For example:
- bullish crossovers near strong support
- bearish crossovers near resistance
can improve contextual understanding significantly.
How Long-Term Investors Use MACD
While MACD is commonly associated with active trading, many long-term investors also use it to better understand broader market cycles. Examples include:
- identifying weakening momentum during euphoric rallies
- recognizing improving strength after major corrections
- reducing emotional reactions during volatility
- improving long-term entry timing gradually
Importantly, experienced investors rarely attempt perfect timing solely with indicators.
Instead, indicators help improve probability and structure.
Common MACD Mistakes
Treating MACD as a Guaranteed Buy Signal
Many beginners assume every bullish crossover guarantees upward movement.
This is false.
MACD only measures momentum behavior — not certainty.
Ignoring Market Context
A bullish MACD signal during broader market panic may fail quickly.
Context always matters.
Overtrading Every Signal
Crypto markets generate constant noise.
Trading every crossover often leads to:
- emotional exhaustion
- excessive fees
- poor risk management
- overtrading losses
Sometimes patience is more valuable than constant activity.
Ignoring Risk Management
No indicator eliminates downside risk.
Strong investing still requires:
- position sizing
- diversification
- emotional discipline
- long-term thinking
Indicators improve structure — not certainty. Also Read ->
Advanced Crypto Investing Strategies – Part 5: Advanced Risk Management
Why Momentum Matters So Much in Crypto
Momentum plays an unusually large role in crypto markets because sentiment changes rapidly.
Strong narratives can attract liquidity aggressively, while fear can trigger rapid collapses.
As a result:
- momentum often accelerates trends
- emotional trading increases volatility
- breakout behavior becomes amplified
Indicators like MACD help investors better understand these momentum shifts instead of reacting emotionally to every price movement.
Conclusion
The MACD indicator is one of the most widely used momentum tools in cryptocurrency investing because it helps investors analyze trend strength, momentum shifts, and potential reversals.
By understanding:
- bullish and bearish crossovers
- momentum acceleration
- MACD divergence
- histogram behavior
- broader market structure
investors can improve decision-making and better interpret crypto market conditions.
However, MACD is not a predictive guarantee.
Like all indicators, it works best when combined with:
- risk management
- emotional discipline
- broader market analysis
- long-term thinking
In volatile crypto markets, momentum matters — but disciplined execution matters even more. Also Read ->
Part 1 — Who Actually Moves the Crypto Market? – Understanding Crypto Market Structure
Disclaimer: This article is for educational purposes only and does not constitute financial advice. Always do your own research before investing in cryptocurrencies.