Moving averages are among the most widely used indicators in financial markets.
In cryptocurrency markets, traders and investors frequently use moving averages to analyze:
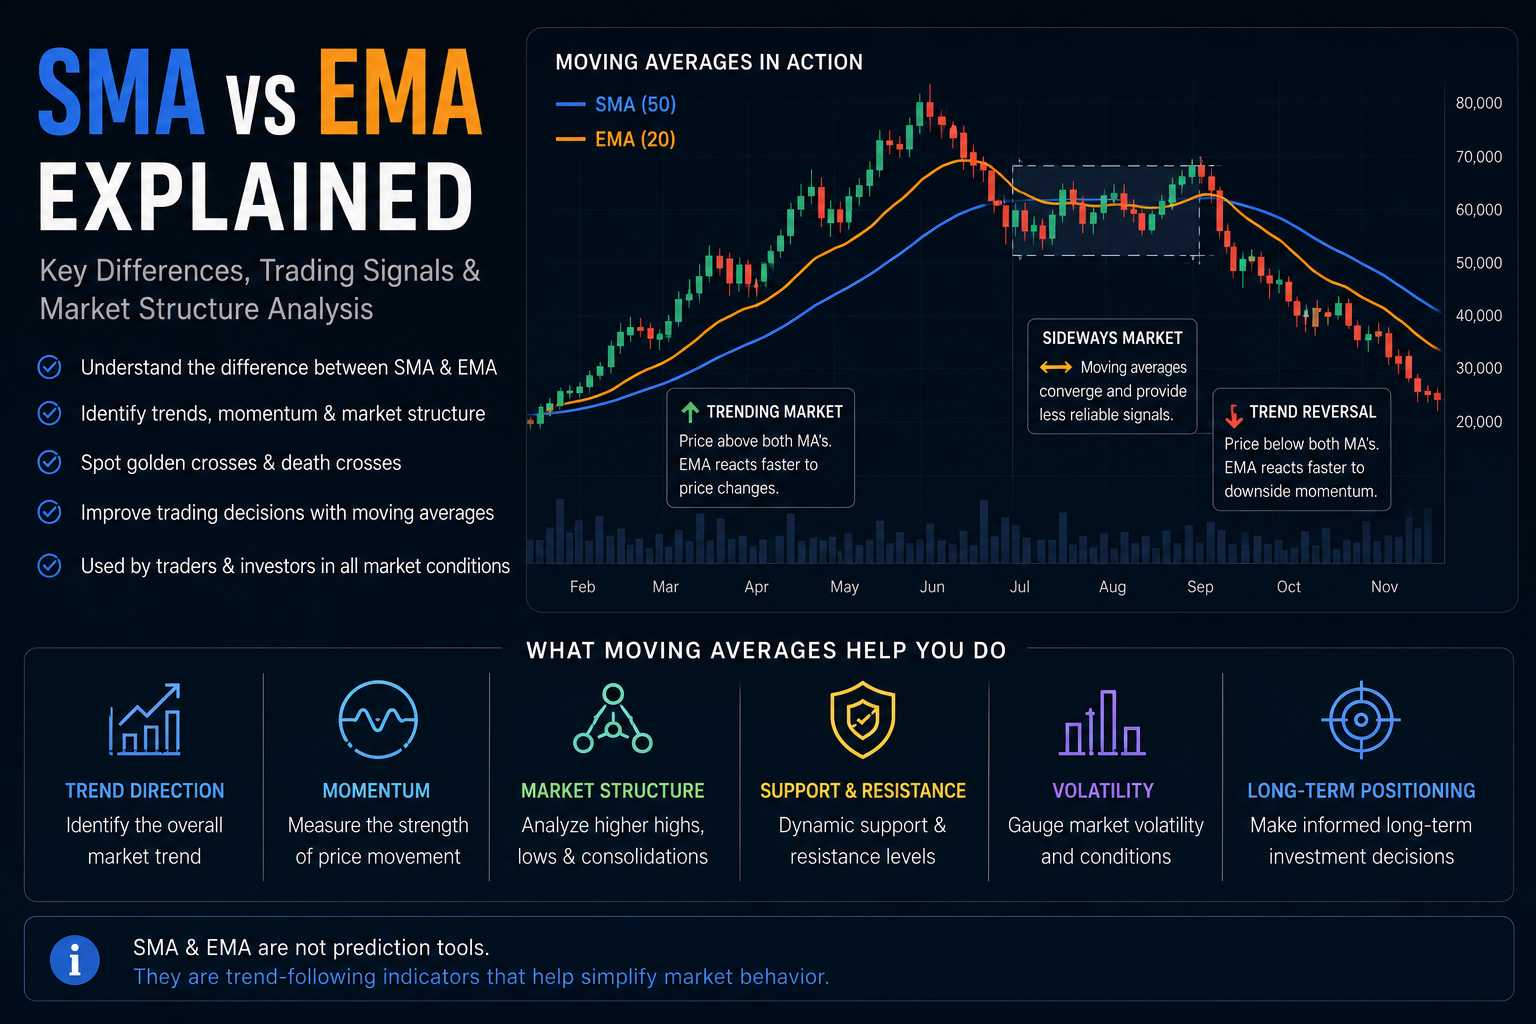
- trend direction
- momentum
- market structure
- support and resistance
- volatility conditions
- long-term positioning
Despite their popularity, many investors misunderstand how moving averages actually work.
Indicators like the Simple Moving Average (SMA) and Exponential Moving Average (EMA) are not prediction tools. Instead, they help simplify price behavior and identify broader market trends within highly volatile environments.
Used correctly, moving averages can improve structure, discipline, and market interpretation.
Used incorrectly, they can create false confidence, overtrading, and poor risk management.
In this analysis, we’ll explore:
- what moving averages are
- the difference between SMA and EMA
- why traders and investors use them
- common SMA and EMA settings
- golden crosses and death crosses
- how moving averages interact with market structure
- why moving averages often fail during sideways markets
- the strengths and limitations of moving average analysis
- how professional investors use SMA and EMA within broader market frameworks
What Are Moving Averages?
A moving average is a technical indicator that smooths out price action over a specific time period.
Rather than focusing on every short-term price fluctuation, moving averages help traders identify the broader underlying trend.
Moving averages are called “moving” because they continuously update as new price data becomes available.
For example:
- a 50-day moving average tracks the average closing price of the last 50 days
- a 200-day moving average tracks the average closing price of the last 200 days
As markets move, the average changes with them.
Because crypto markets are highly volatile, moving averages are commonly used to reduce noise and improve trend visibility.
What Is a Simple Moving Average (SMA)?
A Simple Moving Average (SMA) calculates the average price over a specific period using equal weighting for every data point.
For example:
A 50-day SMA adds together the closing prices of the last 50 days and divides the total by 50.
This creates a smoother and slower-moving trend line.
Because SMAs react more slowly to price changes, they are often used for:
- identifying long-term trends
- filtering short-term volatility
- analyzing broader market structure
- spotting major support and resistance zones
Longer-term investors frequently monitor:
- 50-day SMA
- 100-day SMA
- 200-day SMA
The 200-day SMA is especially important because many investors use it as a long-term trend indicator across both traditional and crypto markets.
What Is an Exponential Moving Average (EMA)?
An Exponential Moving Average (EMA) functions similarly to an SMA but gives more weight to recent price action.
Because newer prices receive greater weighting, EMAs react faster to market changes.
This makes EMAs more sensitive during:
- momentum shifts
- rapid trend reversals
- short-term volatility
- breakout environments
Traders often use EMAs for:
- shorter-term trend analysis
- momentum trading
- dynamic support and resistance
- faster market signals
Common EMA settings include:
- 9 EMA
- 20 EMA
- 21 EMA
- 50 EMA
Because crypto markets move quickly, many traders prefer EMAs during highly active trading environments.
SMA vs EMA: What’s the Difference?
The core difference between SMA and EMA is responsiveness.
SMA:
- smoother
- slower-moving
- less sensitive to short-term volatility
- better for long-term trend analysis
EMA:
- faster-reacting
- more sensitive to recent price action
- better for momentum analysis
- more responsive during trend changes
Neither indicator is universally “better.”
They simply serve different purposes depending on market conditions and investor strategy.
Why Traders Use Moving Averages
Moving averages help traders and investors simplify market structure.
They are commonly used to identify:
- trend direction
- bullish vs bearish environments
- momentum shifts
- support and resistance
- breakout conditions
- trend continuation
For example:
- price above major moving averages often signals stronger bullish structure
- price below major moving averages may indicate weaker market conditions
However, moving averages should never be used in isolation.
Professional investors usually combine moving averages with:
- liquidity analysis
- market structure
- volume analysis
- macro conditions
- derivatives positioning
- sentiment analysis
Moving averages are among the most widely used trend-following indicators in both traditional financial markets and cryptocurrency trading
Common SMA and EMA Settings
Different moving average settings are used for different market objectives.
Common SMA Settings
- 50 SMA → medium-term trend
- 100 SMA → broader structural trend
- 200 SMA → long-term market direction
Common EMA Settings
- 9 EMA → short-term momentum
- 20 EMA → trend continuation
- 21 EMA → swing trading structure
- 50 EMA → medium-term trend analysis
Shorter settings react faster but generate more noise.
Longer settings react slower but provide stronger structural signals.
Golden Cross and Death Cross
Two of the most well-known moving average signals are:
Golden Cross
A Golden Cross occurs when a shorter-term moving average crosses above a longer-term moving average.
Example:
- 50-day SMA crossing above the 200-day SMA
This is often interpreted as a bullish long-term trend signal.
Death Cross
A Death Cross occurs when a shorter-term moving average crosses below a longer-term moving average.
Example:
- 50-day SMA crossing below the 200-day SMA
This is often viewed as a bearish structural signal.
However, these signals are not perfect predictors.
In volatile crypto markets, false signals frequently occur during choppy conditions.
Moving Averages as Dynamic Support and Resistance
Moving averages often act as dynamic support and resistance zones.
During bullish markets:
- price may repeatedly bounce from moving averages
During bearish markets:
- moving averages may act as resistance during rallies
Many traders monitor the:
- 20 EMA
- 50 EMA
- 200 SMA
to evaluate broader trend strength.
However, moving averages are psychological market tools — not guaranteed support or resistance levels.
Why Moving Averages Often Fail During Sideways Markets
One of the biggest weaknesses of moving averages is sideways market behavior.
During consolidation phases:
- trends weaken
- volatility compresses
- price repeatedly crosses moving averages
This creates:
- false breakouts
- fake trend signals
- excessive trading noise
In crypto markets, sideways conditions often produce “whipsaw” behavior where indicators continuously generate misleading signals.
This is one reason professional investors rarely rely on indicators alone.
Understanding broader market structure remains far more important.
Why Sideways Markets Are Where Smart Crypto Investors Win
Moving Averages and Market Psychology
Moving averages also influence trader psychology.
Because millions of traders monitor similar indicators, moving averages can become partially self-fulfilling.
For example:
- traders may buy near major EMAs during bullish trends
- institutions may monitor the 200-day SMA for structural positioning
- algorithmic systems often incorporate moving average frameworks
This collective behavior can temporarily strengthen reactions around key moving average levels.
How Professional Investors Use SMA and EMA
Professional investors rarely use moving averages as standalone buy or sell signals.
Instead, moving averages are often used as:
- trend confirmation tools
- market structure filters
- risk management aids
- volatility frameworks
- momentum indicators
Experienced traders usually combine moving averages with:
- macro analysis
- liquidity conditions
- derivatives positioning
- volume analysis
- market sentiment
- support and resistance structure
This broader framework reduces emotional decision-making and improves context awareness.
Risks and Limitations of Moving Averages
Despite their popularity, moving averages have important limitations.
These include:
- lagging behavior
- false signals
- weak performance during sideways markets
- overreliance by inexperienced traders
- inability to predict unexpected market events
Most importantly:
moving averages react to price — they do not predict the future.
This distinction is critical.
Indicators can help structure analysis, but they cannot eliminate uncertainty or investment risk.
Conclusion
SMA and EMA indicators remain among the most widely used tools in cryptocurrency markets because they help simplify trend analysis and reduce market noise.
While both indicators track market direction, they serve different purposes:
- SMAs are generally slower and better suited for long-term structural analysis
- EMAs react faster and are often preferred for momentum and short-term trend interpretation
Used correctly, moving averages can improve:
- market structure analysis
- trend identification
- emotional discipline
- risk management
- decision-making consistency
However, moving averages also have important limitations and should never be viewed as guaranteed predictive tools.
Professional investors typically combine SMA and EMA analysis with:
- liquidity conditions
- market structure
- macroeconomic analysis
- sentiment evaluation
- volatility assessment
- risk management frameworks
In highly volatile crypto markets, context matters far more than any single indicator.
Understanding how moving averages fit within broader market conditions is often more important than the indicators themselves.
RSI Explained in Crypto: How Investors Use the Relative Strength Index
MACD Indicator in Crypto: Understanding Momentum, Trend Strength & Market Reversals

Disclaimer: This article is for educational and informational purposes only and does not constitute financial or investment advice. Cryptocurrency markets are highly volatile and involve substantial risk. Always conduct your own research before making investment decisions.