
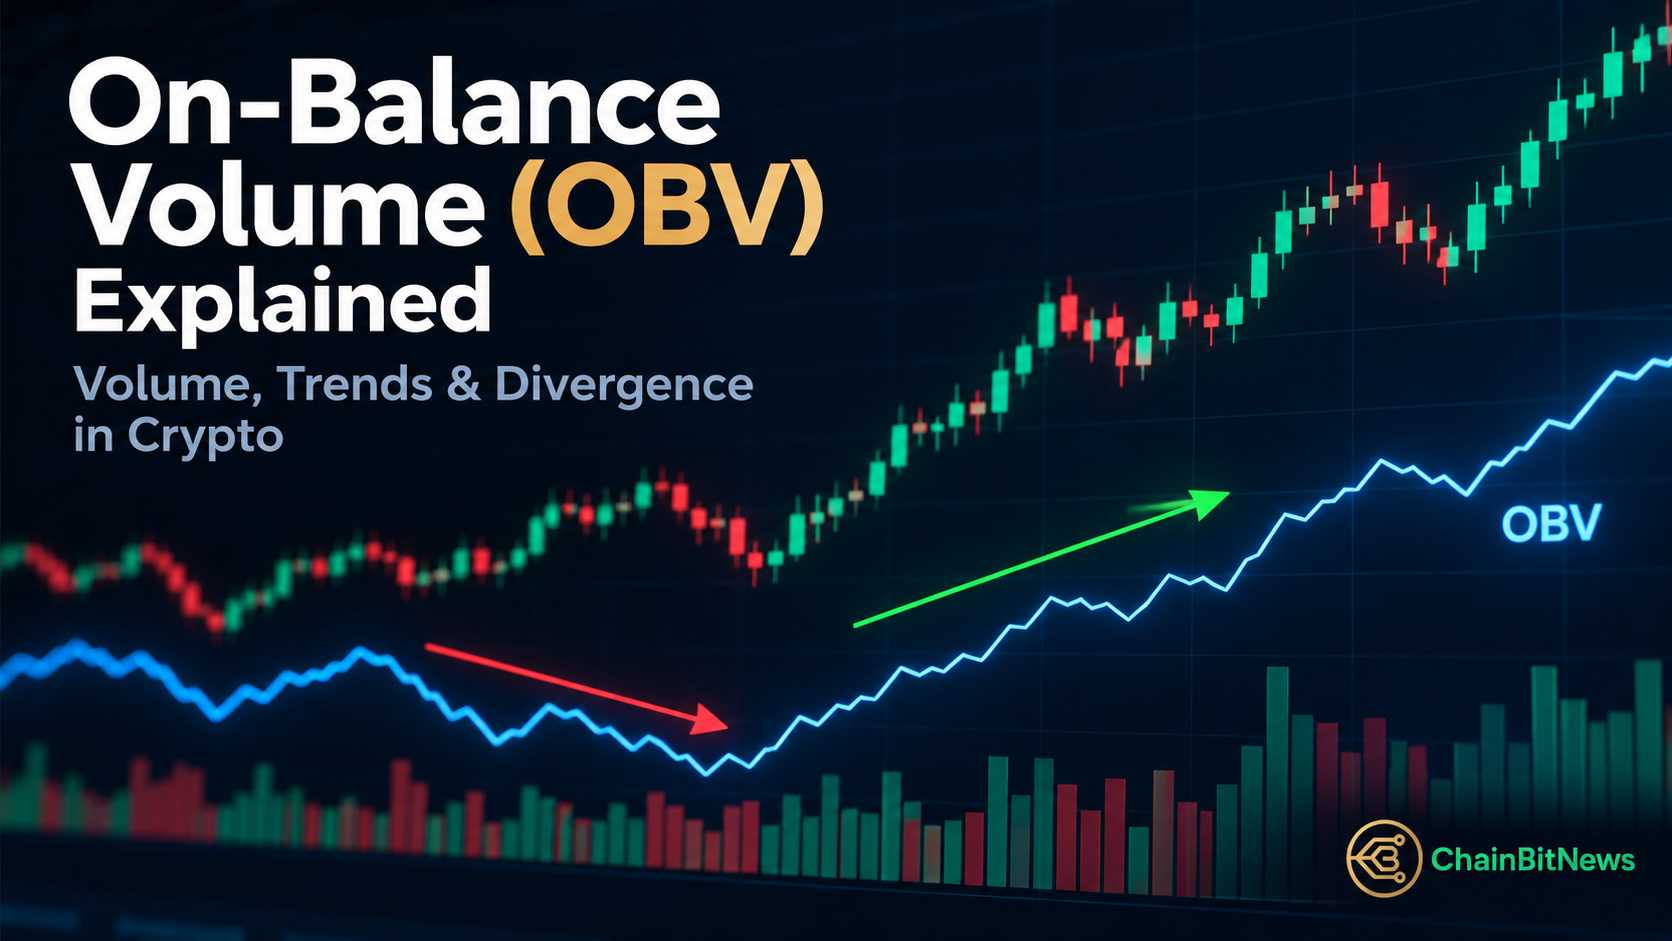
Cryptocurrency prices can move quickly, but price alone does not always reveal what is happening beneath the market.
A rally may look strong while trading activity is weakening. A decline may appear bearish while buying activity is beginning to return.
This is why traders often analyze volume alongside price.
One indicator designed specifically for this purpose is On-Balance Volume (OBV).
OBV combines price direction with trading volume to help traders evaluate whether volume is supporting a market trend. Rather than focusing on the indicator’s absolute value, traders generally study its direction and relationship with price.
In This Analysis, We’ll Explore:
- What On-Balance Volume (OBV) is
- How OBV is calculated
- Why volume matters in crypto
- How to read rising and falling OBV
- How OBV can confirm price trends
- Why the absolute OBV value matters less than its direction
- What bullish and bearish OBV divergence mean
- How OBV can help analyze breakouts
- The limitations of OBV
- How traders can combine OBV with other market signals
What Is On-Balance Volume (OBV)?
On-Balance Volume is a volume-based technical indicator that tracks whether trading volume is generally associated with rising or falling prices.
The principle is simple:
Higher Close → Add Volume
Lower Close → Subtract Volume
Unchanged Close → No Change
Over time, these additions and subtractions create a cumulative OBV line.
Traders then compare the direction of that line with the price chart.
If price and OBV move in the same direction, volume is broadly confirming the trend.
If they begin moving in different directions, it may indicate that the price move is losing support from volume.
OBV does not directly measure money flowing into or out of a cryptocurrency. Instead, it uses trading volume and closing-price direction to estimate the balance between buying and selling activity.
How Is OBV Calculated?
The calculation uses three basic rules.
If today’s closing price is higher than the previous close:
Current OBV = Previous OBV + Current Volume
If today’s closing price is lower:
Current OBV = Previous OBV − Current Volume
If the closing price is unchanged:
Current OBV = Previous OBV
For example, suppose a cryptocurrency closes higher on a day with $500 million in trading volume.
That volume is added to OBV.
If the asset closes lower the following day with $300 million in volume, that volume is subtracted.
Charting platforms calculate this automatically, so traders normally do not need to calculate OBV manually.
The important part is understanding what causes the line to move.
OBV does not consider how large the price movement was. A small positive close still causes the entire period’s volume to be added, while a small negative close causes the volume to be subtracted.
Why Volume Matters in Crypto
Price shows where the market moved.
Volume provides additional information about the trading activity behind that movement.
Imagine Bitcoin breaks above an important resistance level.
If the breakout occurs alongside increasing trading activity, there is more volume participating in the move.
If price breaks resistance while volume remains weak, the breakout may have less participation behind it.
Neither situation guarantees what happens next.
Volume is therefore best viewed as additional market context rather than a prediction.
Crypto also has an important complication: trading is spread across many centralized exchanges, decentralized exchanges, spot markets and derivatives markets.
As a result, volume — and therefore OBV — can differ depending on the exchange or data source being used.
This is one reason traders should avoid treating OBV as a precise measurement of all buying and selling activity across the entire crypto market.
Volume Analysis in Crypto: Market Participation, Trend Strength & Why Volume Matters
How to Read OBV
The easiest way to use OBV is to compare its direction with price.
Price Rising + OBV Rising
This suggests that volume is broadly confirming the upward price trend.
If price continues making higher highs while OBV also trends higher, the two signals are aligned.
Price Falling + OBV Falling
This suggests that volume is broadly confirming the downward trend.
Selling activity is accompanying lower closing prices.
Price and OBV Moving Differently
This is where OBV becomes particularly interesting.
For example:
Price Rising + OBV Falling
or:
Price Falling + OBV Rising
Price and volume are no longer confirming each other.
This does not mean the market must reverse.
Instead, it tells traders that the relationship between price and volume has changed and may deserve closer attention.
OBV and Trend Confirmation
Trend confirmation is one of the simplest uses of OBV.
Suppose Ethereum is forming a series of higher highs and higher lows.
If OBV is also trending upward, volume behavior supports the bullish price structure.
The opposite applies during a downtrend.
If price forms lower highs and lower lows while OBV also declines, volume is broadly confirming the bearish structure.
This leads to a useful question:
Is volume supporting what price appears to be doing?
If price and OBV move together, the trend has confirmation from both price and volume.
If they move differently, traders can investigate whether momentum beneath the price trend may be changing.
Why the Absolute OBV Value Matters Less
Unlike indicators such as RSI, OBV does not have universal levels that indicate overbought or oversold conditions.
An OBV reading of 1 million is not automatically better or worse than a reading of 100 million.
The absolute number depends heavily on the asset, trading volume, timeframe and starting point of the calculation.
Traders therefore focus more on:
- Whether OBV is rising or falling
- Higher highs and lower lows in OBV
- Changes in the OBV trend
- Whether OBV confirms price
- Whether price and OBV begin to diverge
The direction and structure of the OBV line are more useful than the number itself.
And when the direction of OBV begins to differ from the direction of price, traders encounter one of the most important applications of the indicator:
OBV divergence.
What Is OBV Divergence?
OBV divergence occurs when price and On-Balance Volume move in different directions.
Normally, traders expect volume behavior to support the price trend.
When that relationship changes, it can suggest that buying or selling pressure beneath the market is shifting.
There are two main types:
- Bullish OBV divergence
- Bearish OBV divergence
Divergence should not be treated as an automatic reversal signal. Markets can continue moving in the same direction even after divergence appears.
Instead, divergence acts as a warning that the existing trend may no longer be receiving the same support from volume.
Bullish OBV Divergence
Bullish divergence can develop when price continues weakening while OBV begins strengthening.
For example:
Price → Lower Low
OBV → Higher Low
Price is still showing bearish structure, but OBV suggests that volume behavior is becoming more positive.
This may indicate that selling pressure is weakening or that buying activity is increasing beneath the surface.
However, bullish divergence alone does not confirm a reversal.
Traders may look for additional evidence such as:
- A break above resistance
- A change in market structure
- Stronger buying volume
- Confirmation from another indicator
The key point is that OBV is beginning to behave differently from price.
Bearish OBV Divergence
Bearish divergence is the opposite.
It can occur when price continues rising while OBV begins weakening.
For example:
Price → Higher High
OBV → Lower High
Price appears bullish, but volume is no longer confirming the strength of the move.
This can suggest that participation behind the rally is weakening.
Again, it does not guarantee that price will decline.
Strong trends can continue despite divergence.
Bearish OBV divergence is therefore better viewed as a reason to become more cautious rather than an immediate sell signal.
OBV and Crypto Breakouts
OBV can also provide useful context around support and resistance levels.
Suppose Bitcoin has repeatedly failed to move above an important resistance level.
Eventually, price breaks higher.
If OBV is also rising or breaking above a previous high, volume behavior is supporting the breakout.
In simple terms:
Price Breakout + Strong OBV → More Confirmation
A breakout accompanied by weak or declining OBV may deserve more caution.
This does not mean low-volume breakouts must fail.
It simply means OBV provides less confirmation that broader trading activity is supporting the move.
The same principle can be applied to bearish breakdowns below support.
OBV During Sideways Markets
OBV can sometimes become useful when price is moving sideways.
During consolidation, price may remain within a relatively narrow range while OBV begins developing a clearer trend.
For example, price may remain flat while OBV gradually rises.
This suggests that more volume is occurring during positive closing periods.
Alternatively, falling OBV during sideways price action may indicate increasing volume during negative closes.
These changes can provide additional context, but they should not be used to predict a breakout direction with certainty.
Price still needs to confirm the move.
OBV vs Trading Volume
Standard volume bars show how much trading activity occurred during each period.
OBV takes that information and converts it into a cumulative indicator based on whether price closed higher or lower.
This creates an important difference.
Volume shows activity.
OBV helps visualize how that activity relates to price direction over time.
Neither is necessarily better.
Standard volume can be useful for identifying sudden spikes in trading activity, while OBV makes longer-term volume trends easier to compare with price.
Using both can provide a clearer picture than relying on either one alone.
OBV vs RSI and Other Indicators
OBV measures something different from momentum indicators such as the Relative Strength Index (RSI).
RSI primarily evaluates the strength and speed of recent price movements.
OBV focuses on the relationship between volume and price direction.
This means the two indicators can complement each other.
For example, a trader might observe:
- Price approaching resistance
- OBV trending upward
- RSI showing improving momentum
Several different types of evidence are then pointing in a similar direction.
However, adding more indicators does not automatically make an analysis better.
Using several indicators that measure nearly the same thing can simply create unnecessary complexity.
The goal should be confirmation from different types of market information.
Limitations of OBV in Crypto
Like every technical indicator, OBV has limitations.
One of the most important in cryptocurrency markets is fragmented volume data.
Bitcoin, Ethereum and other cryptocurrencies trade across many exchanges. An OBV chart based on one exchange reflects the volume recorded on that platform, not necessarily the entire global market.
Sudden volume spikes can also distort the OBV line.
Because the full volume of a period is added or subtracted based only on whether price closed higher or lower, an unusually large-volume period can have a significant effect on the indicator.
OBV also does not measure the size of the price movement.
A 0.1% increase and a 10% increase are both treated as positive closes.
For these reasons, OBV should not be interpreted as a precise measure of capital entering or leaving an asset.
Common OBV Mistakes
One common mistake is treating every divergence as a reversal signal.
Divergence can persist for a long time while price continues trending.
Another mistake is focusing too heavily on the numerical OBV value rather than its direction.
Traders may also assume that rising OBV automatically means price must rise next.
It does not.
OBV is most useful when combined with the broader chart structure.
Support, resistance, trend direction, liquidity and general market conditions can all influence what happens next.
A Simple Way to Use OBV
OBV does not need to make technical analysis complicated.
A simple framework is to ask three questions:
1. What is price doing?
Is the market trending upward, downward or sideways?
2. What is OBV doing?
Is the OBV line rising, falling or consolidating?
3. Do price and OBV confirm each other?
If both move in the same direction, volume broadly supports the trend.
If they move differently, investigate whether a divergence is developing.
This keeps OBV in its most useful role:
a confirmation tool rather than a prediction machine.
Conclusion
On-Balance Volume provides a simple way to study the relationship between price and trading volume.
When price and OBV move together, volume can provide additional confirmation of the existing trend.
When they begin moving differently, bullish or bearish divergence may signal that the underlying volume structure is changing.
OBV can also provide useful context around breakouts and sideways markets.
But the indicator has limitations.
Crypto volume is fragmented across exchanges, large volume spikes can distort the OBV line, and divergence does not guarantee a reversal.
For that reason, OBV works best alongside price structure, support and resistance, and other forms of market analysis.
The purpose of OBV is not to predict exactly where cryptocurrency prices will move next.
It helps answer a simpler question:
Is volume confirming what price is telling us?
MACD Indicator in Crypto: Understanding Momentum, Trend Strength & Market Reversals
Bollinger Bands Explained: Volatility, Market Structure & How Crypto Traders Use Them
Fibonacci Retracement Explained: Support, Resistance & Why Crypto Traders Use Fibonacci Levels
Disclaimer: This article is for educational and informational purposes only and does not constitute financial or investment advice. Cryptocurrency markets are highly volatile and involve significant risk. Technical indicators can produce false signals and should not be used as the sole basis for investment or trading decisions.