
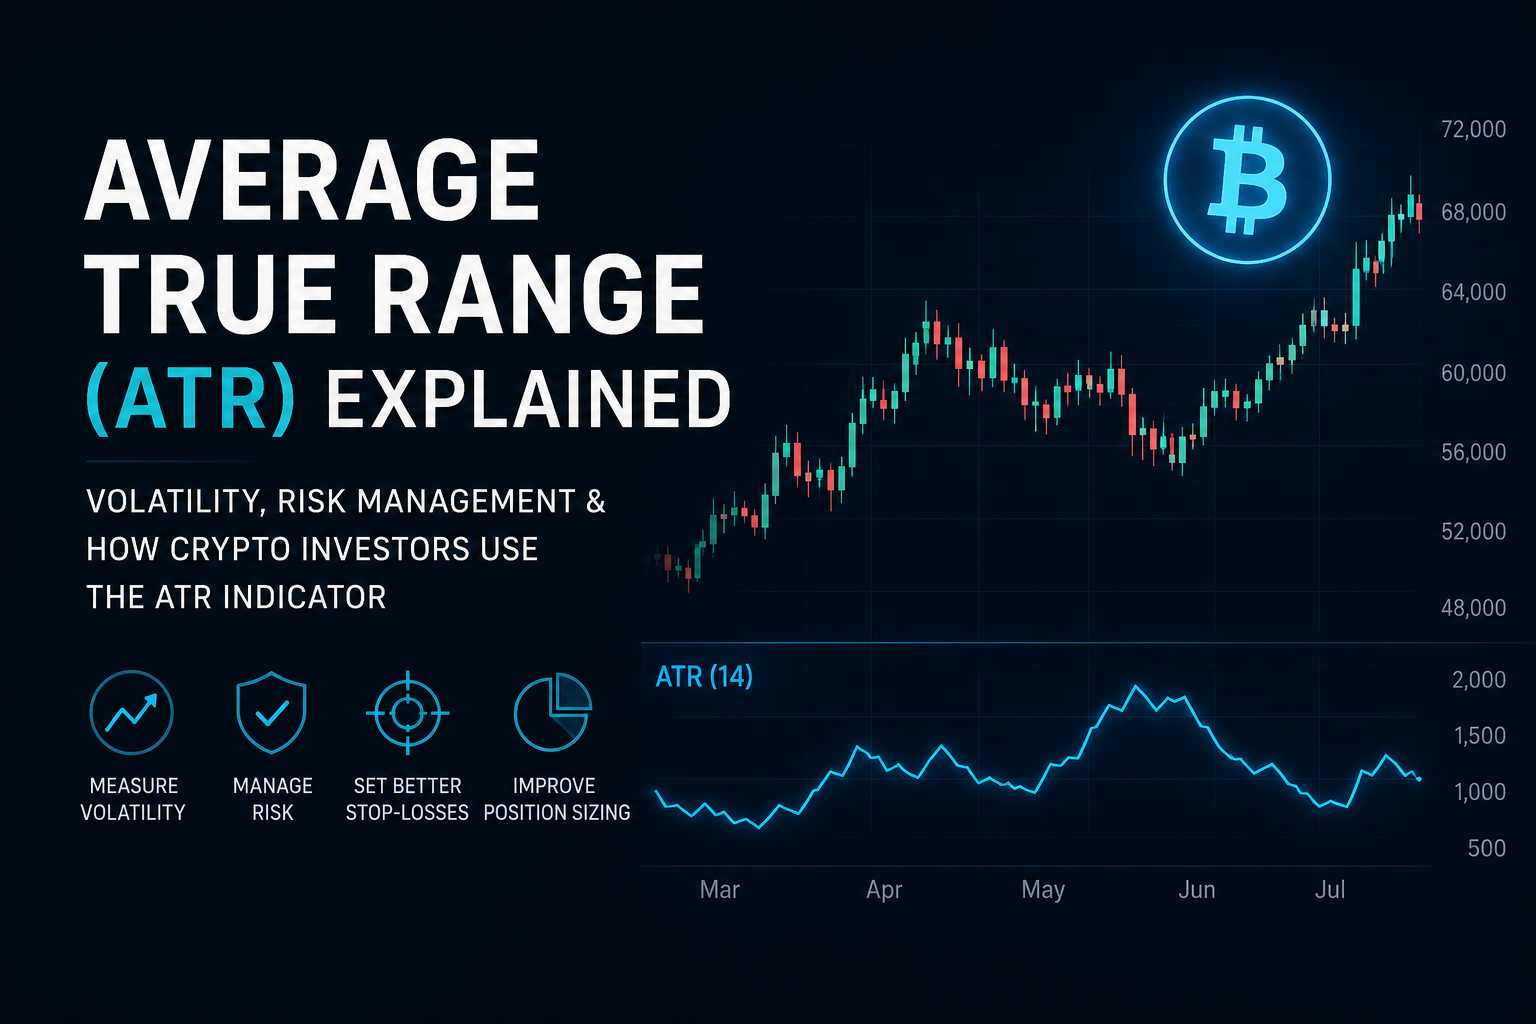
Cryptocurrency markets are known for their volatility.
Large price swings can occur within hours.
Strong rallies often develop unexpectedly.
Sharp corrections can erase weeks of gains.
For investors and traders alike, understanding volatility is just as important as understanding price direction.
One of the most widely used indicators for measuring market volatility is the Average True Range (ATR).
Unlike indicators that attempt to predict whether prices will rise or fall, the ATR measures how much an asset typically moves over a given period.
Professional traders use the ATR to estimate volatility, manage risk, determine position sizes and place more informed stop-loss levels.
Rather than generating buy or sell signals on its own, the ATR provides valuable context that helps investors adapt their strategies to changing market conditions.
Understanding how the ATR works can therefore improve both risk management and decision-making in cryptocurrency markets.
In This Analysis, We’ll Explore:
- what the Average True Range (ATR) is
- how the ATR works
- what True Range means
- how the ATR is calculated
- why volatility matters
- interpreting ATR values
- high ATR versus low ATR
- ATR and market structure
- ATR for stop-loss placement
- ATR for position sizing
- ATR with trend analysis
- ATR with other indicators
- common mistakes
- strengths and limitations
- why long-term investors should understand ATR
What Is the Average True Range (ATR)?
The Average True Range, commonly abbreviated as ATR, is a technical indicator that measures market volatility.
Unlike many technical indicators, the ATR does not indicate whether prices are likely to rise or fall.
Instead, it measures how much prices typically move during each trading period.
A higher ATR indicates larger price swings.
A lower ATR indicates smaller price swings.
Because the ATR measures movement rather than direction, it can be useful during both bull markets and bear markets.
Professional investors often use the ATR to understand current market conditions before making trading or investment decisions.
Why Volatility Matters
Volatility represents one of the defining characteristics of cryptocurrency markets.
Bitcoin, Ethereum and many altcoins regularly experience price movements that would be considered unusual in traditional financial markets.
Understanding volatility helps investors:
- estimate potential risk
- adjust position sizes
- avoid overly tight stop losses
- identify changing market conditions
- compare different cryptocurrencies
Markets with higher volatility require different risk management strategies than relatively stable markets.
The ATR helps quantify this volatility in an objective way.
Understanding True Range
Before understanding the Average True Range, it is important to understand True Range itself.
True Range measures the largest price movement occurring during a single trading period.
Rather than looking only at the difference between the day’s high and low, True Range also accounts for price gaps between trading sessions.
For each candle, the True Range equals the greatest of the following:
- the current high minus the current low
- the current high minus the previous close
- the previous close minus the current low
Using the largest of these values provides a more complete measurement of actual market movement.
This makes the ATR more accurate than simply measuring daily price ranges.
How the ATR Is Calculated
The Average True Range is calculated by averaging multiple True Range values over a selected period.
The most common setting is 14 periods, although traders may choose shorter or longer timeframes depending on their strategy.
The calculation follows three basic steps:
- Calculate the True Range for each candle.
- Repeat this over the selected number of periods.
- Average those values to produce the ATR.
As new candles form, older values gradually drop out of the calculation.
This allows the ATR to continuously adapt to changing market conditions.
Fortunately, investors do not need to perform these calculations manually.
Virtually every charting platform automatically calculates the ATR.
High ATR vs Low ATR
Interpreting the ATR is relatively straightforward.
A high ATR generally indicates that volatility is increasing.
This often occurs during:
- strong trends
- market breakouts
- panic selling
- rapid rallies
- major news events
A low ATR indicates relatively quiet market conditions.
Low volatility often appears during:
- consolidation
- ranging markets
- accumulation phases
- periods of reduced trading activity
Neither high nor low ATR is inherently bullish or bearish.
The indicator measures movement—not direction.
For this reason, investors should always interpret ATR alongside other forms of market analysis.
ATR and Market Structure
The ATR becomes particularly useful when combined with market structure.
For example, increasing ATR during a confirmed breakout may indicate growing market participation and stronger momentum.
Conversely, declining ATR during a prolonged sideways market often reflects decreasing volatility as buyers and sellers reach temporary equilibrium.
Professional traders rarely evaluate the ATR in isolation.
Instead, they ask questions such as:
- Is volatility expanding alongside the trend?
- Is the breakout supported by increasing market activity?
- Is current volatility consistent with previous market phases?
By combining volatility measurements with broader market structure, investors gain a more complete understanding of current market conditions.
ATR and Stop-Loss Placement
One of the ATR’s most practical applications involves stop-loss placement.
Many inexperienced traders place stop losses at arbitrary percentages.
Professional traders often prefer volatility-based approaches.
Because cryptocurrencies frequently experience normal short-term fluctuations, placing stop losses too close to the current price can result in unnecessary exits.
The ATR helps estimate how much normal price movement should be expected.
Rather than choosing an arbitrary distance, traders often place stop losses beyond normal market volatility.
This approach attempts to reduce the likelihood of being stopped out by ordinary price fluctuations while still limiting overall risk.
ATR for Position Sizing
Risk management involves more than deciding where to place a stop loss.
Professional investors also determine how much capital to allocate to each position.
The ATR can help with this process.
When volatility increases, price movements become larger.
Holding the same position size during highly volatile conditions may expose investors to greater risk.
Conversely, lower volatility may allow for larger positions while maintaining the same overall level of risk.
For this reason, many professional traders adjust their position sizes based on current ATR values.
Although the exact approach varies between strategies, the underlying principle remains consistent:
Higher volatility generally requires smaller positions.
Lower volatility may allow larger positions.
Using the ATR in this way helps create a more consistent approach to portfolio risk.
Position Sizing in Crypto: How to Allocate Capital Without Destroying Your Portfolio
Combining ATR with Trend Analysis
The ATR works best when combined with other analytical tools.
Because it measures volatility rather than direction, investors should interpret it alongside indicators that identify trends.
Common combinations include:
For example:
A breakout above resistance accompanied by rising ATR may suggest increasing market participation.
On the other hand, rising ATR during a strong downtrend may indicate increasing selling pressure.
Combining multiple indicators provides greater context than relying on the ATR alone.
ATR During Different Market Phases
Volatility changes throughout every market cycle.
Understanding how the ATR behaves during different phases can help investors interpret changing conditions.
Accumulation
ATR often remains relatively low.
Price movements become smaller as buyers and sellers reach temporary balance.
Expansion
ATR usually begins rising.
Breakouts generate larger price movements.
Momentum strengthens.
Participation increases.
Distribution
Volatility often increases further.
Prices continue moving aggressively, but market uncertainty also grows.
False breakouts become more common.
Contraction
ATR frequently remains elevated.
Fear increases.
Large daily price swings become common as selling pressure accelerates.
Recognizing these patterns helps investors understand whether changing volatility supports the broader market structure.
Common Mistakes When Using ATR
Although the ATR is straightforward, many investors misuse it.
Common mistakes include:
- assuming ATR predicts price direction
- using ATR without analyzing market structure
- relying on a single indicator
- ignoring broader market conditions
- treating every ATR increase as bullish
- forgetting that volatility can expand in both directions
The ATR simply measures how much prices are moving.
It does not explain why they are moving.
Successful investors therefore combine the ATR with technical analysis, liquidity analysis and broader market context.
Strengths of the ATR
The Average True Range remains popular because it provides objective measurements of market volatility.
Key strengths include:
- simple to understand
- measures actual market volatility
- useful across all timeframes
- supports better risk management
- improves stop-loss placement
- assists with position sizing
- works during both bull and bear markets
- complements many other indicators
Because volatility influences nearly every trading decision, the ATR remains one of the most practical indicators available.
Limitations of the ATR
Despite its usefulness, the ATR also has limitations.
These include:
- it does not predict market direction
- it generates no buy or sell signals
- it reacts to volatility rather than forecasting it
- sudden news events can rapidly change ATR values
- it should never be used as a standalone indicator
Like every technical indicator, the ATR performs best as part of a broader analytical framework rather than as an isolated decision-making tool.
Why Long-Term Investors Should Understand ATR
The ATR is often associated with active trading.
However, long-term investors can also benefit from understanding it.
Volatility influences:
- portfolio risk
- market sentiment
- position sizing
- entry timing
- capital preservation
Periods of unusually high ATR often reflect heightened uncertainty.
Lower ATR values frequently accompany periods of stability and consolidation.
Understanding these changes helps long-term investors remain objective instead of reacting emotionally to short-term market fluctuations.
Rather than predicting future prices, the ATR helps investors understand the environment in which prices are moving.
Conclusion
The Average True Range is one of the most widely used indicators for measuring market volatility.
Unlike indicators designed to identify trends or momentum, the ATR focuses solely on how much prices typically move over a given period.
Professional investors use the ATR to improve risk management, determine position sizes and place more informed stop-loss levels.
Because the ATR measures volatility rather than direction, it works best when combined with broader market analysis, trend indicators and sound risk management principles.
Understanding how volatility changes throughout different market phases allows investors to make more informed decisions regardless of whether markets are rising, falling or moving sideways.
For both traders and long-term investors, the ATR is less about predicting the future and more about understanding the level of risk currently present in the market.
Think Like a Smart Crypto Investor Part 1: Why Mindset Matters More Than Price
Advanced Crypto Investing Strategies – Part 1: Portfolio Allocation & Diversification
Understanding Crypto Market Structure – Part 1 Who Actually Moves the Crypto Market?
Disclaimer: This article is for educational and informational purposes only and does not constitute financial or investment advice. Cryptocurrency markets are highly volatile and involve significant risk. Always conduct your own research and consider your financial circumstances before making investment decisions.